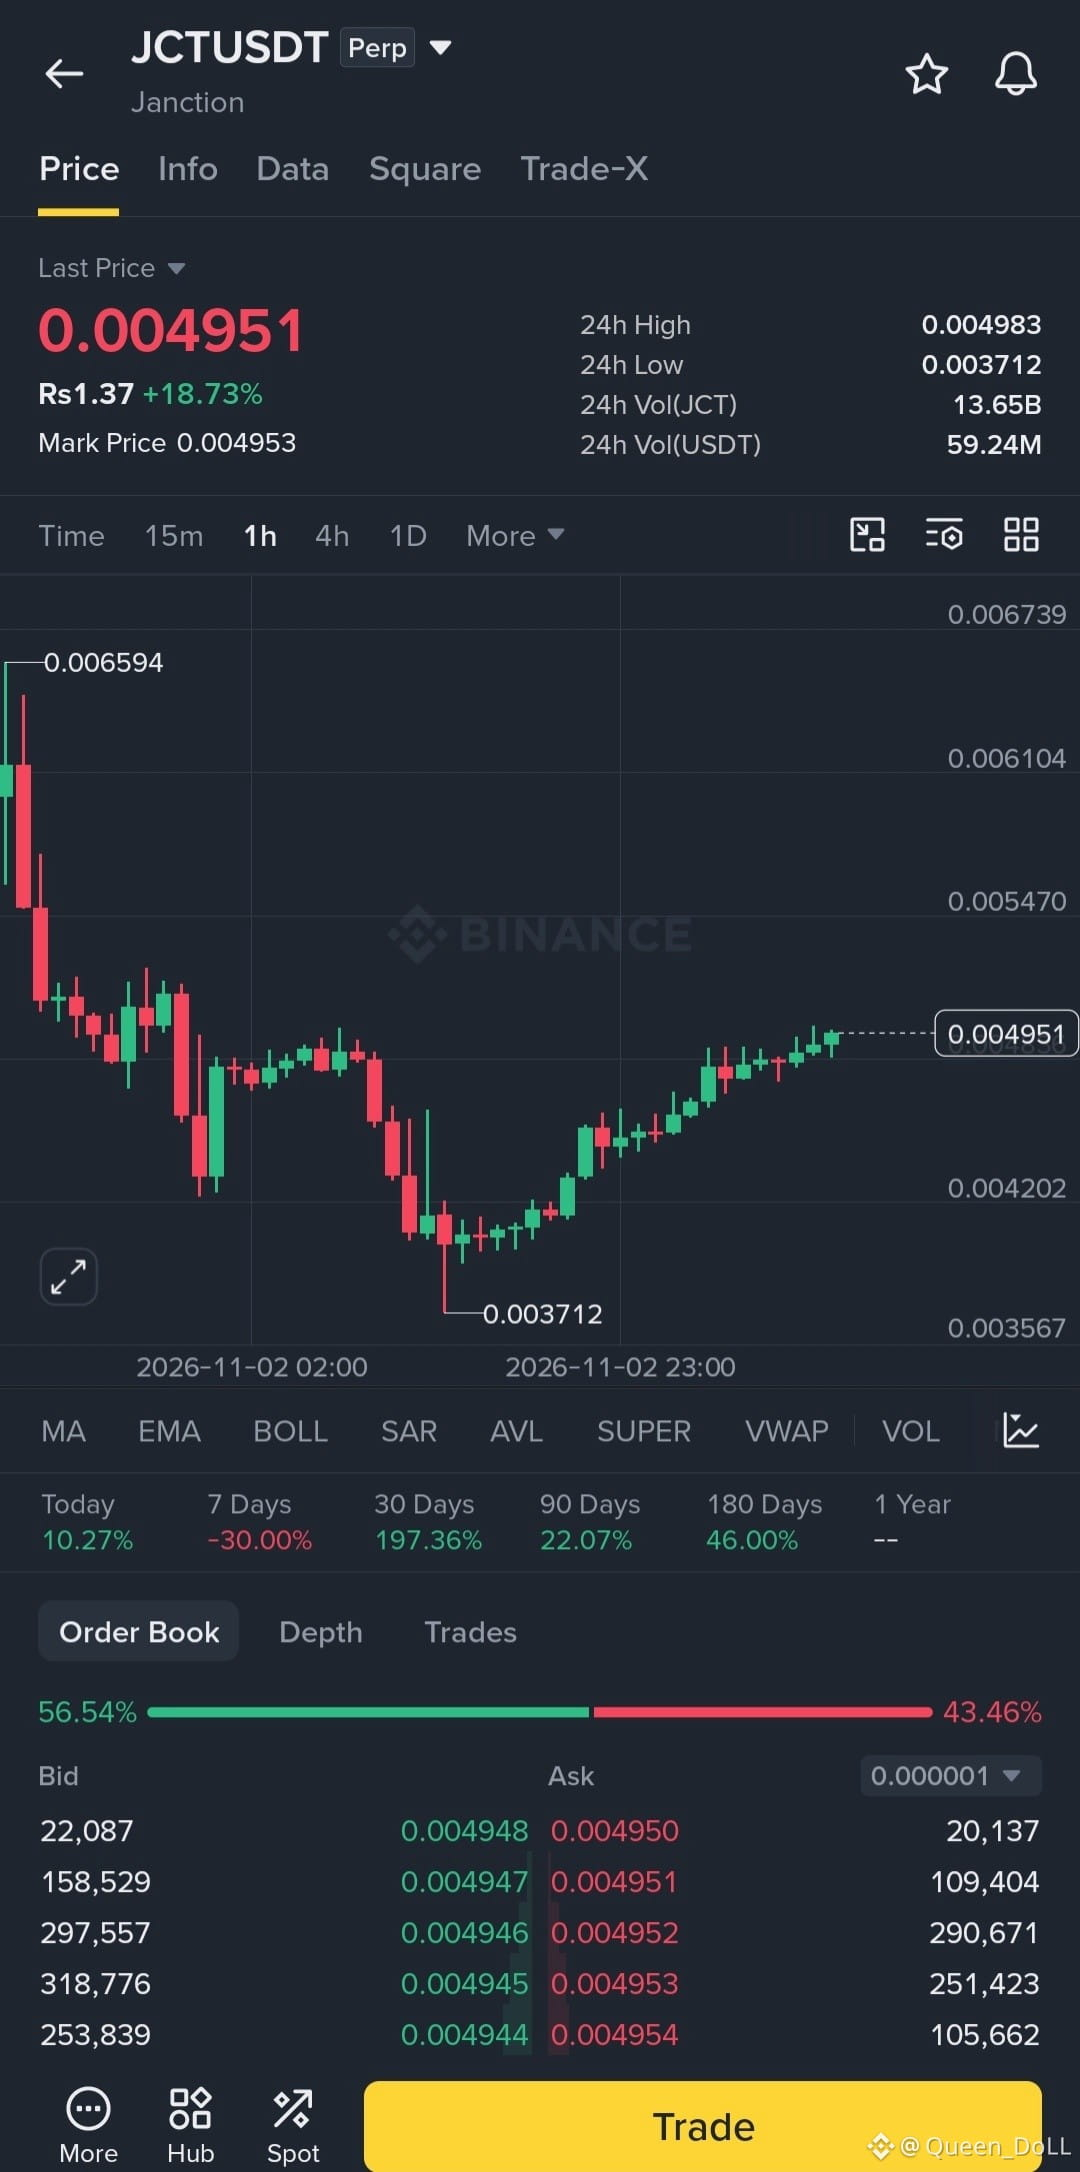
$JCT (JCTUSDT) — LONG
Entry Zone: 0.00485 – 0.00498
Stop Loss: 0.00465
TP1: 0.00547
TP2: 0.00610
TP3: 0.00659
Analysis:
JCT is showing a gradual bullish recovery after bouncing from the 0.003712 low. On the 1H chart, buyers have been pushing price higher with consecutive green candles. Price is now approaching immediate resistance around 0.004983. A clean breakout above this level could open the door toward higher targets. However, rejection and a drop below 0.00465 would weaken the bullish structure.
Can JCT break above 0.0050 and continue its recovery, or will sellers step in at resistance?
DYOR NFA
$ARIA $SOXS
#JCT #Janction #CryptoSignals #FuturesTrading #BinanceSquare
Entry Zone: 0.00485 – 0.00498
Stop Loss: 0.00465
TP1: 0.00547
TP2: 0.00610
TP3: 0.00659
Analysis:
JCT is showing a gradual bullish recovery after bouncing from the 0.003712 low. On the 1H chart, buyers have been pushing price higher with consecutive green candles. Price is now approaching immediate resistance around 0.004983. A clean breakout above this level could open the door toward higher targets. However, rejection and a drop below 0.00465 would weaken the bullish structure.
Can JCT break above 0.0050 and continue its recovery, or will sellers step in at resistance?
DYOR NFA
$ARIA $SOXS
#JCT #Janction #CryptoSignals #FuturesTrading #BinanceSquare