🚨 The Wildest Chart on Binance?! A Look at $TRUMP
USDT 🚨
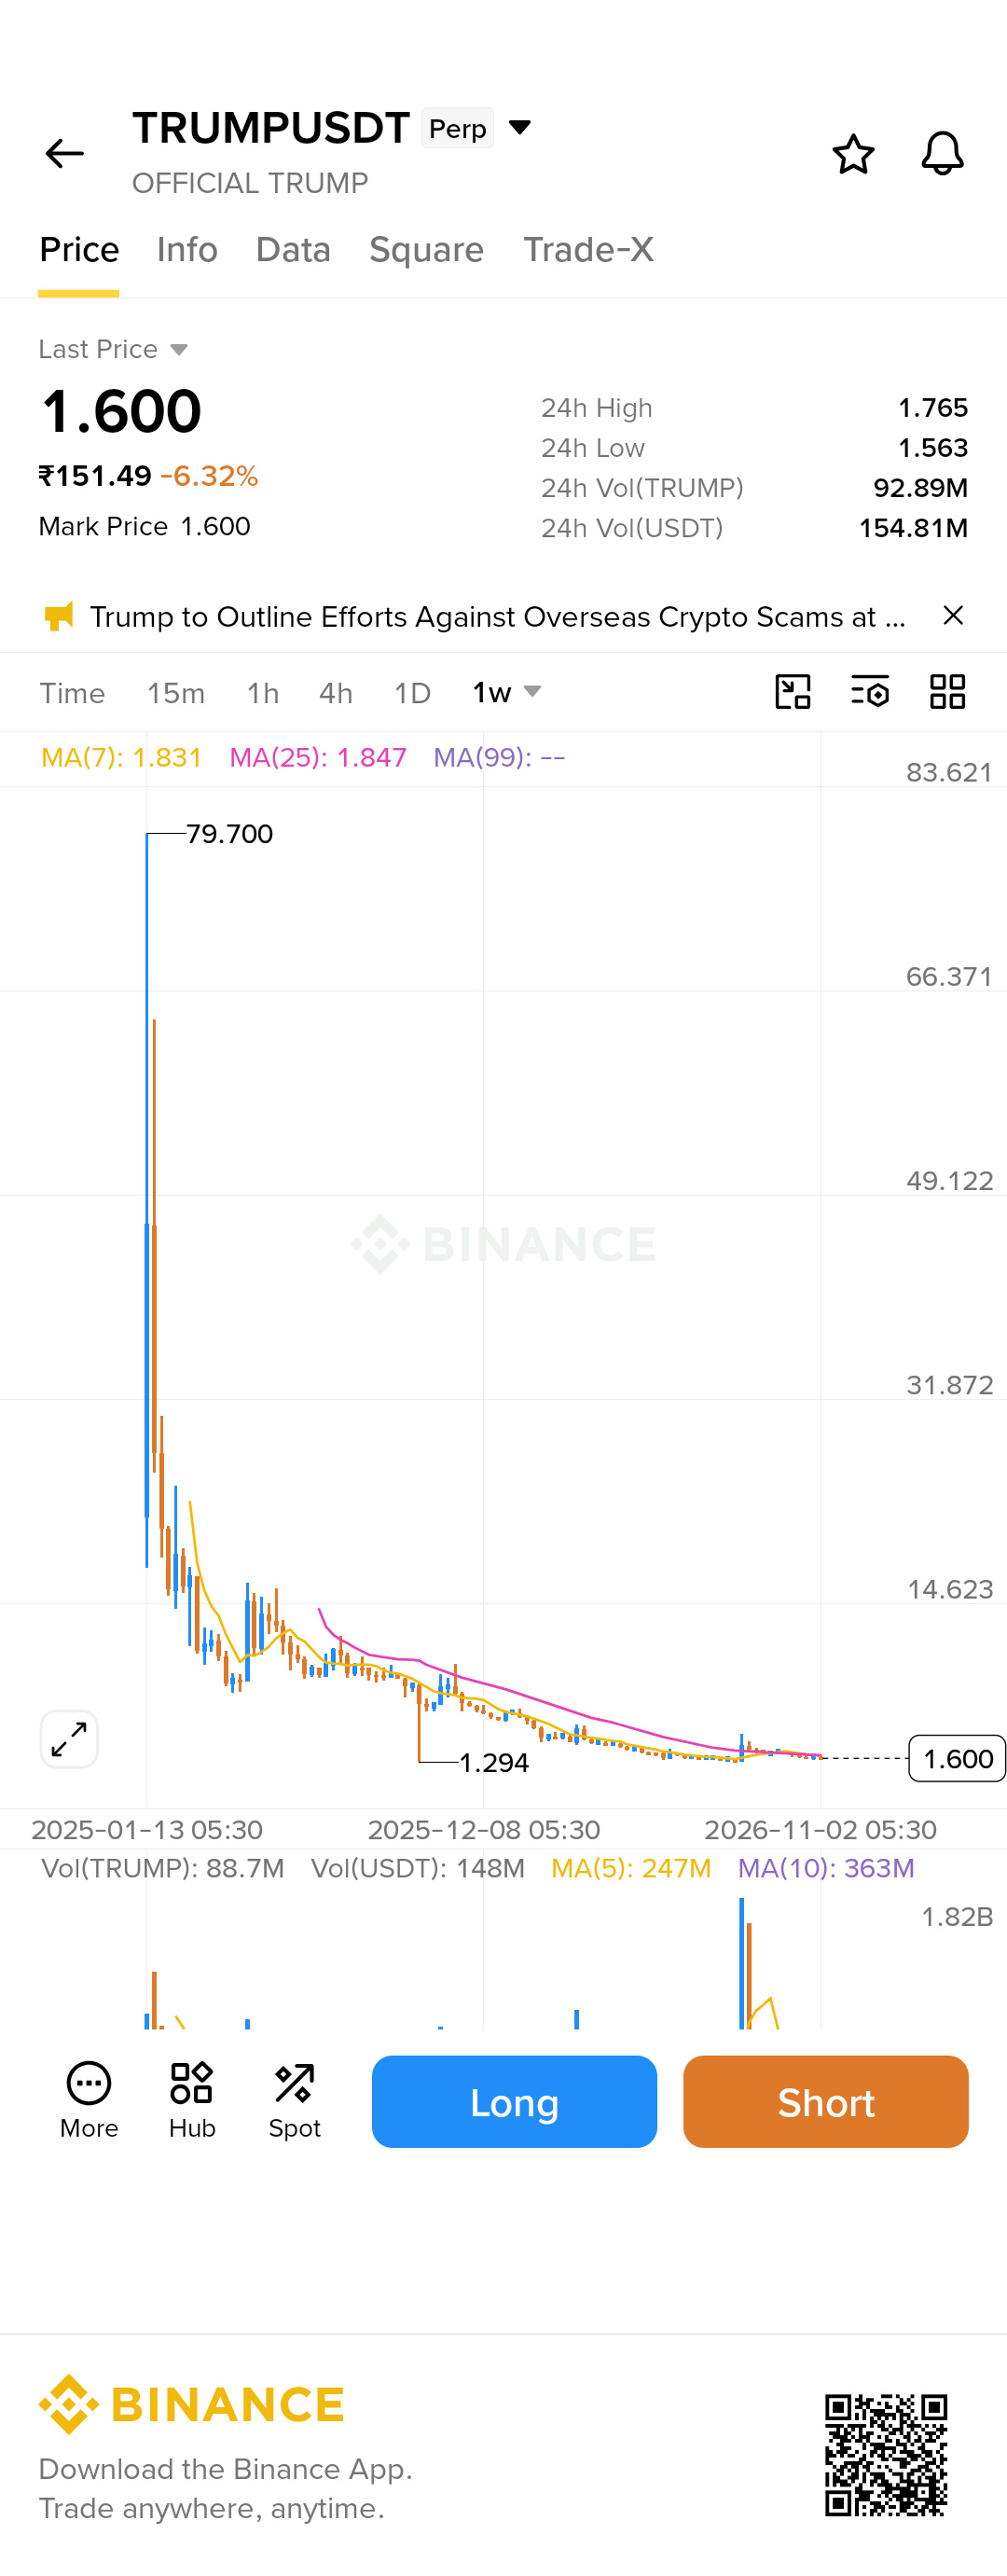
Have you checked the TRUMPUSDT Perp chart lately? As you can see in the attached 28132.jpg file, the historical price action is absolutely insane. 🤯
Taking a look at the weekly timeframe, we can see that massive historical wick hitting a staggering $79.70 all-time high before an aggressive sell-off. Fast forward to today, and we are heavily consolidated around the $1.60 mark, currently down over 6% for the day. 📉
A few key takeaways:
* Extreme Volatility: This chart is a textbook reminder of how wild market listing wicks and meme/hype tokens can be.
* Consolidation: The price has flattened out significantly along the moving averages over the past year.
* Support/Resistance: With the 24h low at $1.563 and high at $1.765, it's currently chopping in a very tight range compared to its history.
After such a massive macro cool-down, the real question is whether the bottom is finally in, or if it will keep bleeding out.
Look at the chart—if you had to choose right now, are you hitting that Long or Short button? 🐂🐻 Let me know your price targets in the comments below! 👇
#TRUMPUSDT #cryptotrading #MarketVolatility #BinanceFutures #TradingSignals
USDT 🚨
Have you checked the TRUMPUSDT Perp chart lately? As you can see in the attached 28132.jpg file, the historical price action is absolutely insane. 🤯
Taking a look at the weekly timeframe, we can see that massive historical wick hitting a staggering $79.70 all-time high before an aggressive sell-off. Fast forward to today, and we are heavily consolidated around the $1.60 mark, currently down over 6% for the day. 📉
A few key takeaways:
* Extreme Volatility: This chart is a textbook reminder of how wild market listing wicks and meme/hype tokens can be.
* Consolidation: The price has flattened out significantly along the moving averages over the past year.
* Support/Resistance: With the 24h low at $1.563 and high at $1.765, it's currently chopping in a very tight range compared to its history.
After such a massive macro cool-down, the real question is whether the bottom is finally in, or if it will keep bleeding out.
Look at the chart—if you had to choose right now, are you hitting that Long or Short button? 🐂🐻 Let me know your price targets in the comments below! 👇
#TRUMPUSDT #cryptotrading #MarketVolatility #BinanceFutures #TradingSignals