SUI/USDT 1D Technical Analysis: Can SUI Hold the Current Support?
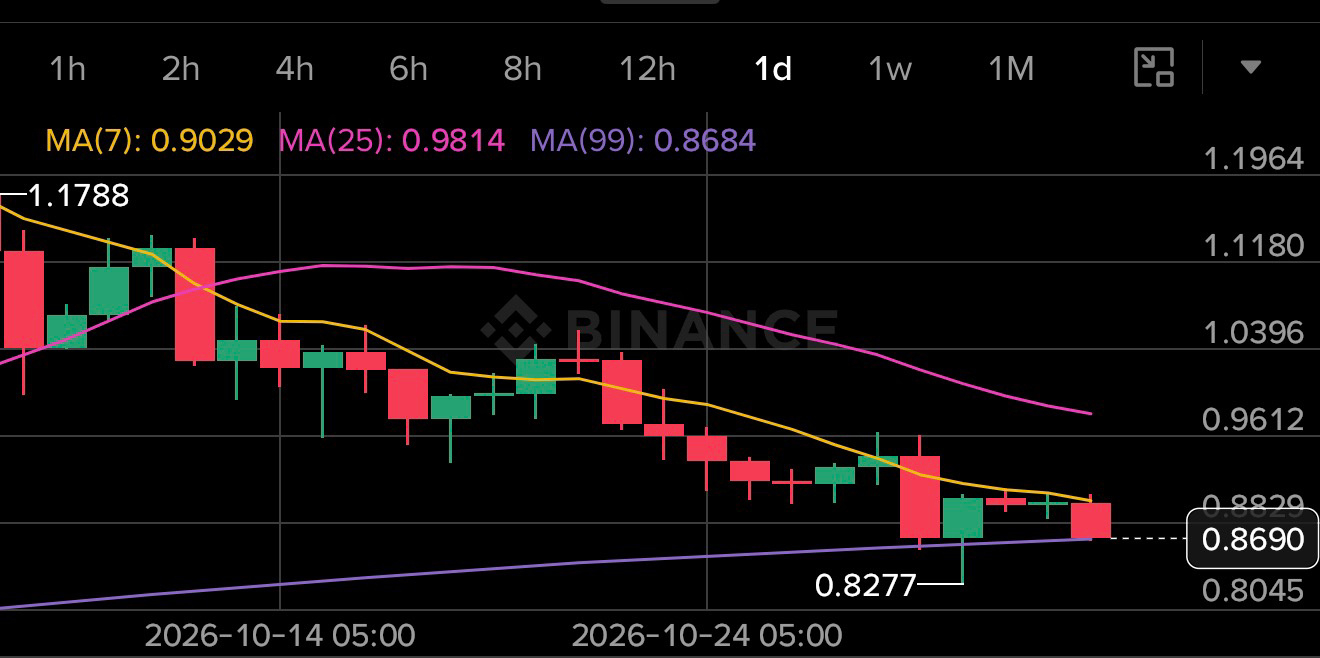
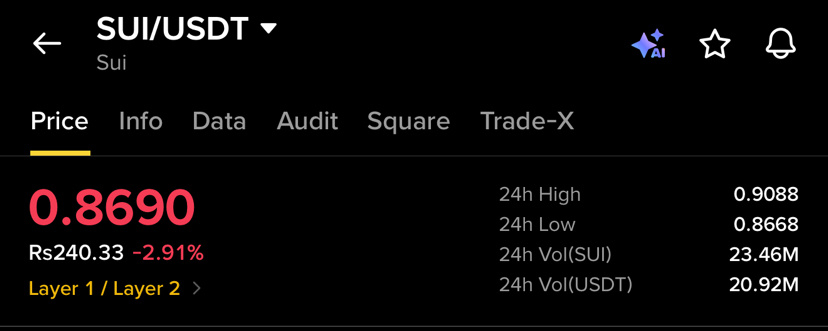
SUI/USDT is currently trading around $0.8690, with the pair showing a daily decline of approximately 2.91%. The 1D chart presents a clear shift from the strong upside move seen earlier to a prolonged period of selling pressure and lower price levels.
Looking at the broader daily structure, SUI previously climbed strongly from the $0.70–$0.80 area and reached above $1.20. However, after that rally, the market started forming a series of lower highs and lower lows. This indicates that sellers have gradually gained control of the short- to medium-term trend.
📉 Current 1D Structure
The most important feature on the chart is the extended decline from the $1.20+ zone. After reaching the higher levels, SUI failed to maintain bullish momentum and repeatedly moved toward lower support areas.
At the moment, price is around $0.8690, while the displayed 24-hour high is approximately $0.9088 and the 24-hour low is around $0.8668.
The latest candles are relatively small compared with the larger candles seen during the earlier rally. This suggests that the market is currently in a more cautious phase, with buyers and sellers competing around the present price area.
🟢 Important Support Zone
The $0.86–$0.87 area is currently one of the most important zones on the chart.
Price has recently returned to this region after failing to hold above $0.90. If buyers manage to defend this area and produce stronger bullish daily candles, it could become the foundation for a short-term recovery.
A sustained move above $0.90 would be an early sign that buying pressure is returning.
On the other hand, if the $0.86 area fails to hold and daily candles continue closing below this zone, the market could potentially search for the next lower support areas.
🔴 Resistance Levels to Watch
The first important resistance is around $0.90–$0.92. This zone is close to the recent price action and could become a selling area if SUI attempts a recovery.
Above that, the $0.95–$1.00 region becomes much more important. The $1.00 psychological level in particular could attract significant attention from traders.
A stronger recovery would require SUI to reclaim these levels with convincing daily candles and increasing trading activity.
The previous structure around $1.05–$1.15 represents another major resistance area because the price spent considerable time there before continuing its decline.
📊 Volume Is Also Important
The volume shown on the 1D chart has generally decreased compared with the much larger volume seen during the earlier price movement.
Lower volume during a declining market can sometimes indicate that selling momentum is becoming less aggressive, but it does not automatically mean a reversal is confirmed.
For a stronger bullish move, it would be healthier to see increasing volume together with a breakout above nearby resistance.
That combination would provide more confirmation than a price move occurring on weak volume.
🔎 What Could Happen Next?
There are two important scenarios to watch from the current structure.
Bullish scenario:
If SUI holds the $0.86–$0.87 support zone, buyers could attempt to push the price back toward $0.90, followed by the $0.95–$1.00 area. A successful breakout above $1.00 could significantly improve the daily structure and bring higher resistance zones back into focus.
Bearish scenario:
If the current support fails and SUI continues closing below the $0.86 area, the recent downward structure could remain intact. In that situation, traders may start watching the lower support zones for signs of stabilization.
🧠 Overall 1D Outlook
At the current price, SUI is still showing a bearish-to-neutral daily structure. The long decline from above $1.20 has not yet been reversed, and the chart needs a series of stronger higher highs and higher lows before a clear trend reversal can be established.
For now, $0.86–$0.87 is the key area to watch on the downside, while $0.90–$0.92 is the first important hurdle on the upside.
The next major move could become clearer once SUI either decisively breaks below its current support or reclaims the nearby resistance with stronger volume.
Key levels:
🟢 Support: $0.86–$0.87
🟡 Resistance: $0.90–$0.92
🔴 Major resistance: $0.95–$1.00
📈 Higher resistance: $1.05–$1.15
For SUI traders, the reaction around the current support zone could be particularly important in determining whether the market is preparing for stabilization or another leg lower.
Haan, is SUI article ke liye ye hashtags best rahenge:
#SUI #SUIUSDT #SuiNetwork #Crypto #CryptoAnalysis #TechnicalAnalysis #Altcoins #BinanceSquare
Agar short aur clean rakhna hai to sirf ye 5 use karo:
#SUI #CryptoAnalysis #TechnicalAnalysis #altcoins $SUI