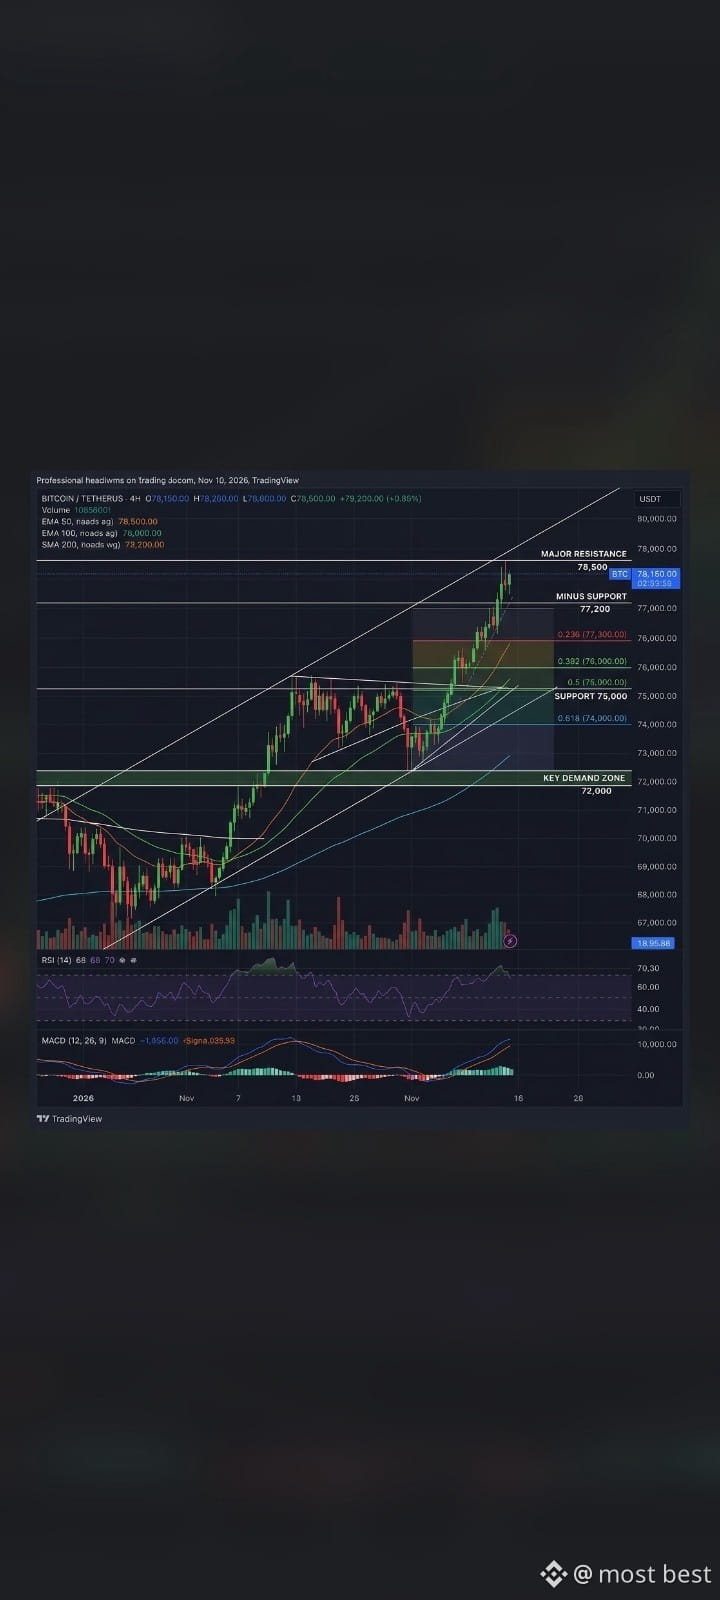
Resistance & Support: A major resistance level is established near $78,500, while critical support zones lie down at $75,000 and the key demand zone at $72,000.
Trend Lines & Patterns: The chart highlights precise technical breakdown structures and trend lines, signaling potential downward pressure if price action faces rejection at the upper resistance zones.
Indicators: Momentum oscillators like RSI and MACD are integrated at the bottom to reflect the current market sentiment and shifting trend momentum.
Trend Lines & Patterns: The chart highlights precise technical breakdown structures and trend lines, signaling potential downward pressure if price action faces rejection at the upper resistance zones.
Indicators: Momentum oscillators like RSI and MACD are integrated at the bottom to reflect the current market sentiment and shifting trend momentum.