#BNB/USDT Position Update & Technical Analysis! 📊
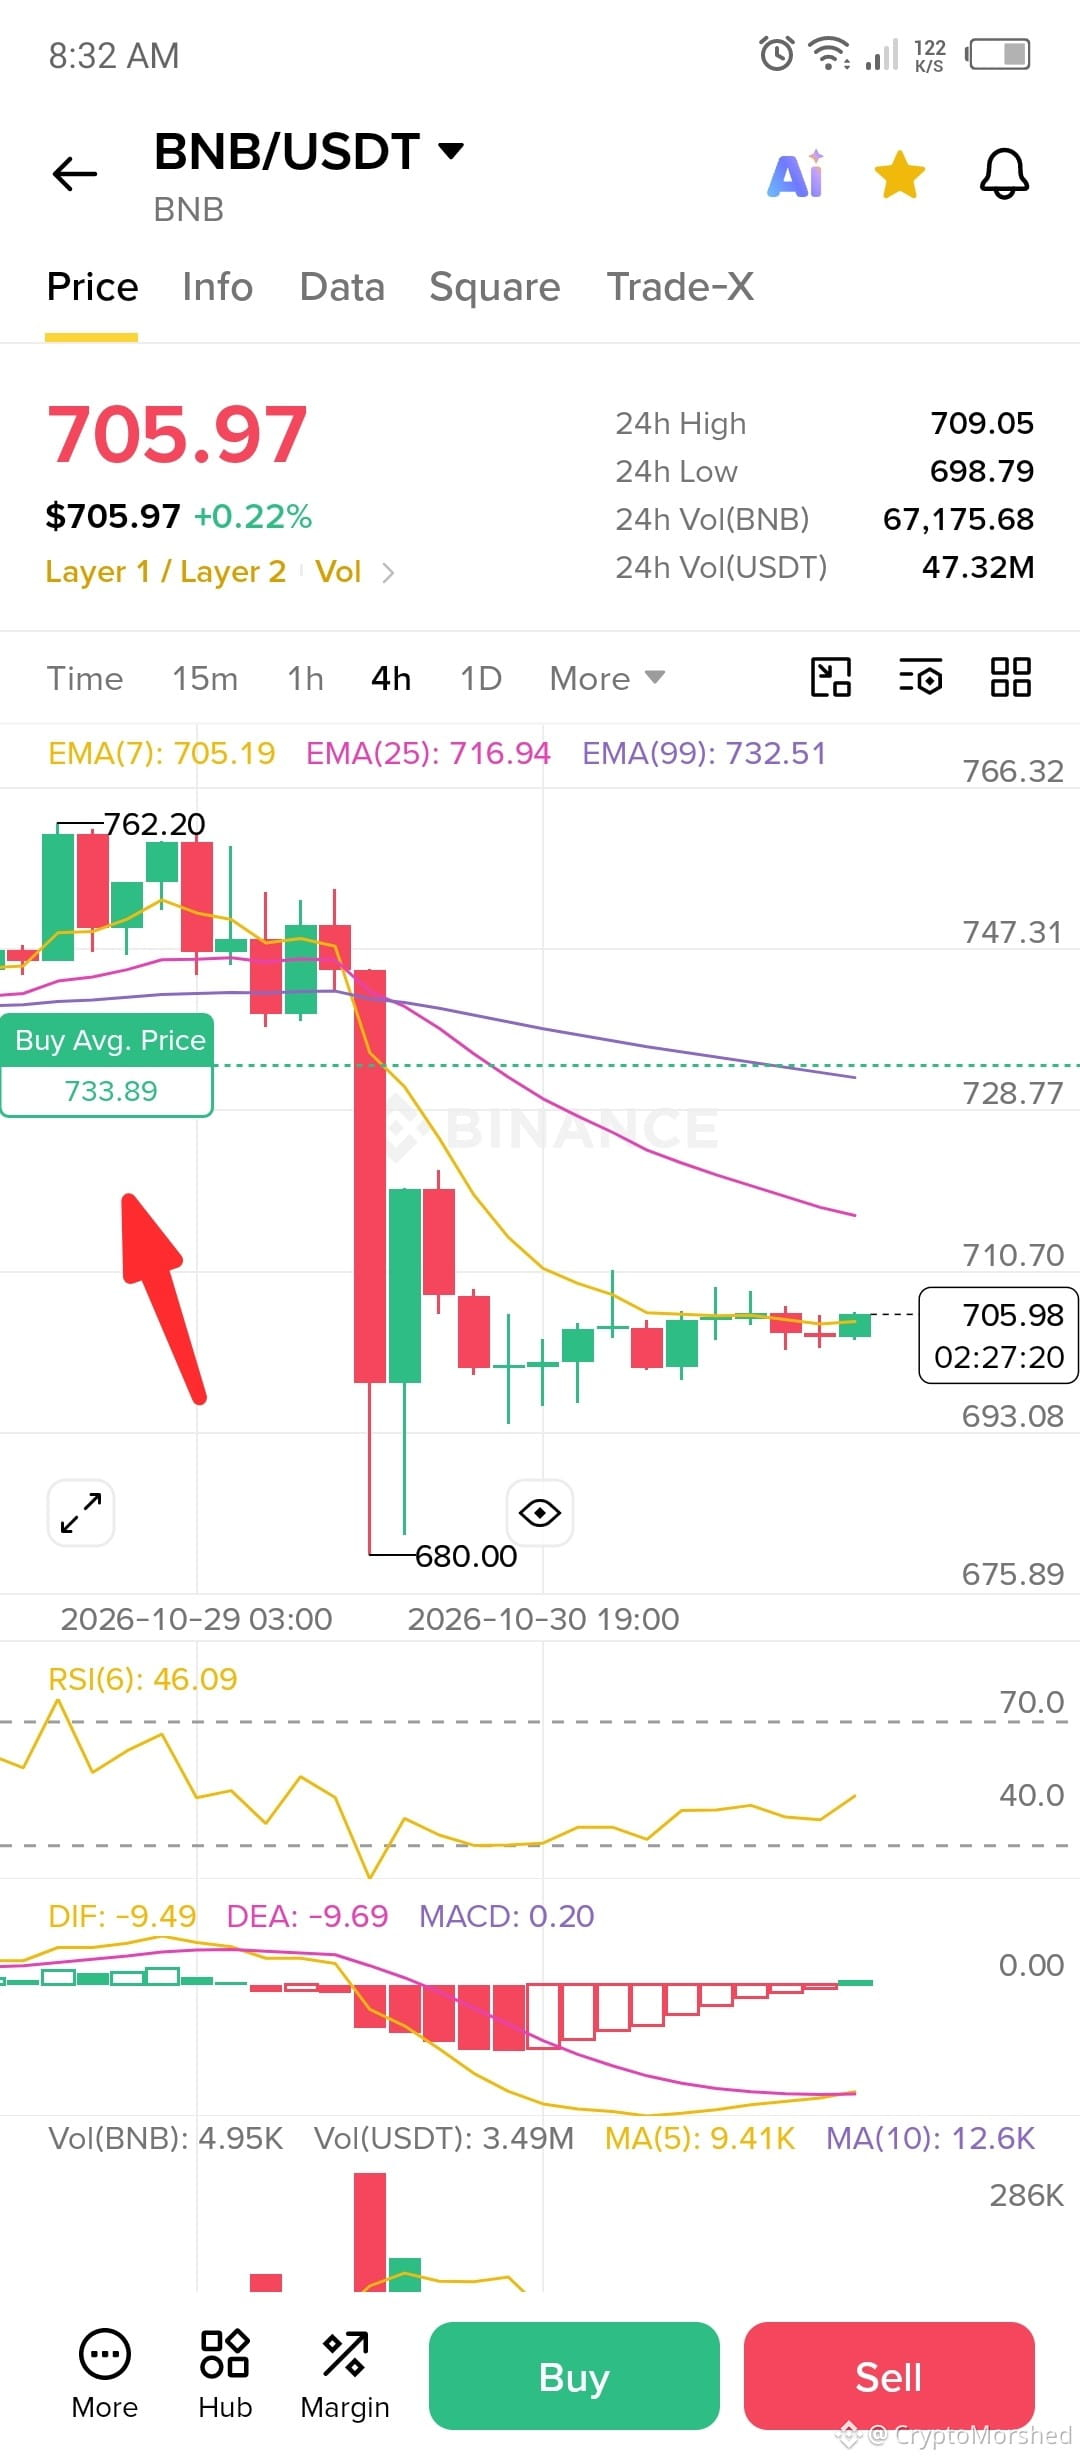
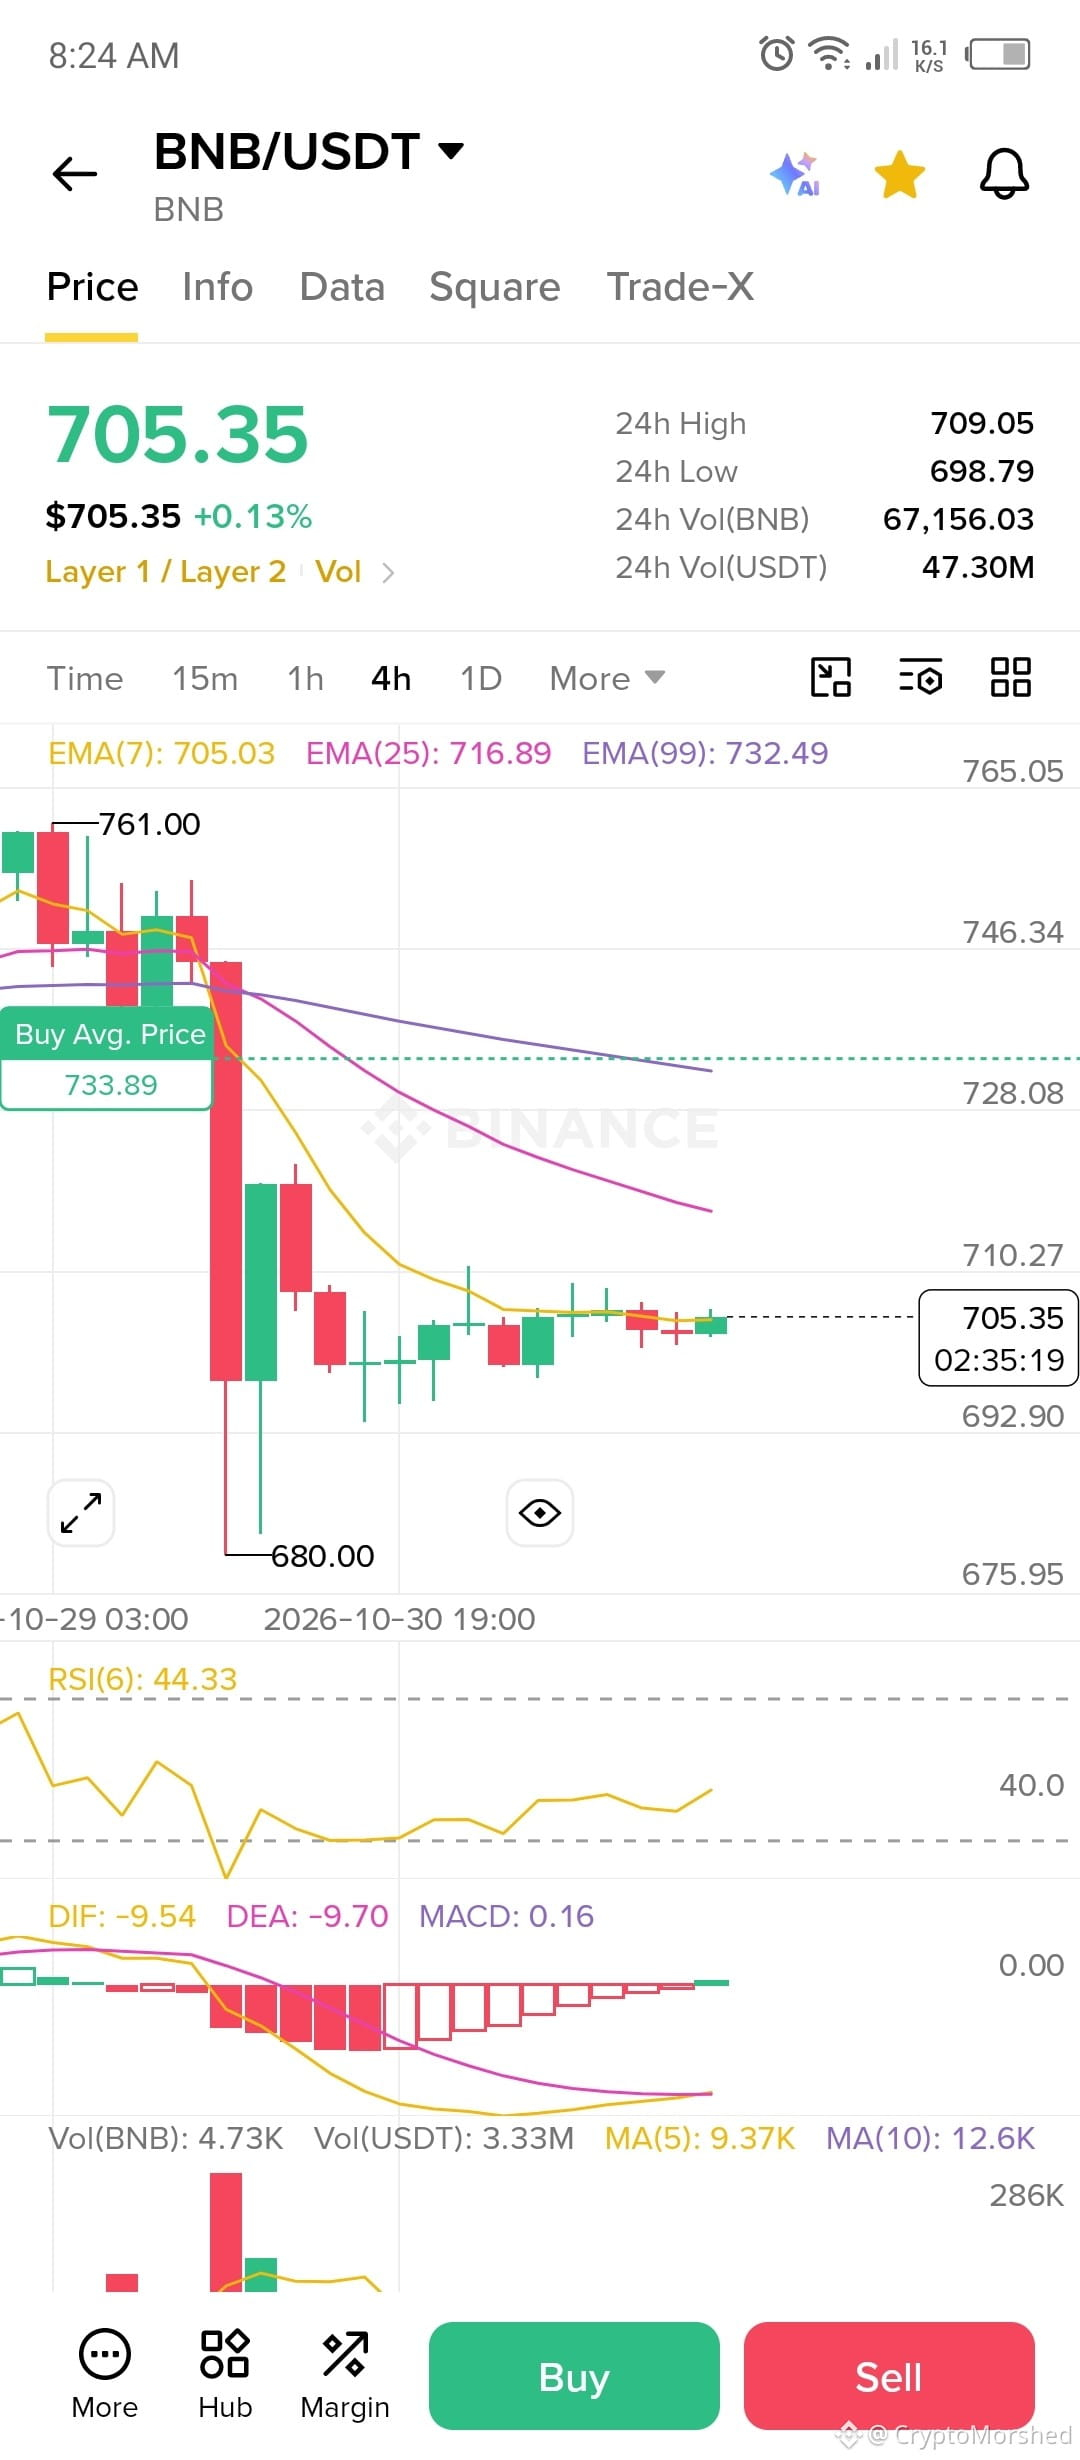
My current buy average sits at $733.89. After a sharp rejection from the $761 local high, the market found decent support around the $680 region and is currently consolidating at $705.35.
Key Technical Indicators:
• Price & EMAs: Trading below the EMA 25 ($716.89) and EMA 99 ($732.49), indicating a short-term bearish structure. The EMA 99 perfectly aligns with my entry, meaning it will act as heavy overhead resistance on a relief rally.
• RSI (6): Sits at 44.33. Immediate panic selling has paused, and the market is entering a neutral consolidation phase.
• MACD: Deep below the zero line, but a tiny green histogram bar (0.16) suggests dynamic selling momentum is slowing down.
The $680 support floor is highly crucial right now. If it holds, we might see a push toward $710 and a retest of my break-even zone. What are your thoughts? Is a recovery inbound, or are we testing $680 again?
#BNB #CryptoTrading #TechnicalAnalysis #Binance #BinanceSAFUFundTransferCompleted7499BTC
My current buy average sits at $733.89. After a sharp rejection from the $761 local high, the market found decent support around the $680 region and is currently consolidating at $705.35.
Key Technical Indicators:
• Price & EMAs: Trading below the EMA 25 ($716.89) and EMA 99 ($732.49), indicating a short-term bearish structure. The EMA 99 perfectly aligns with my entry, meaning it will act as heavy overhead resistance on a relief rally.
• RSI (6): Sits at 44.33. Immediate panic selling has paused, and the market is entering a neutral consolidation phase.
• MACD: Deep below the zero line, but a tiny green histogram bar (0.16) suggests dynamic selling momentum is slowing down.
The $680 support floor is highly crucial right now. If it holds, we might see a push toward $710 and a retest of my break-even zone. What are your thoughts? Is a recovery inbound, or are we testing $680 again?
#BNB #CryptoTrading #TechnicalAnalysis #Binance #BinanceSAFUFundTransferCompleted7499BTC