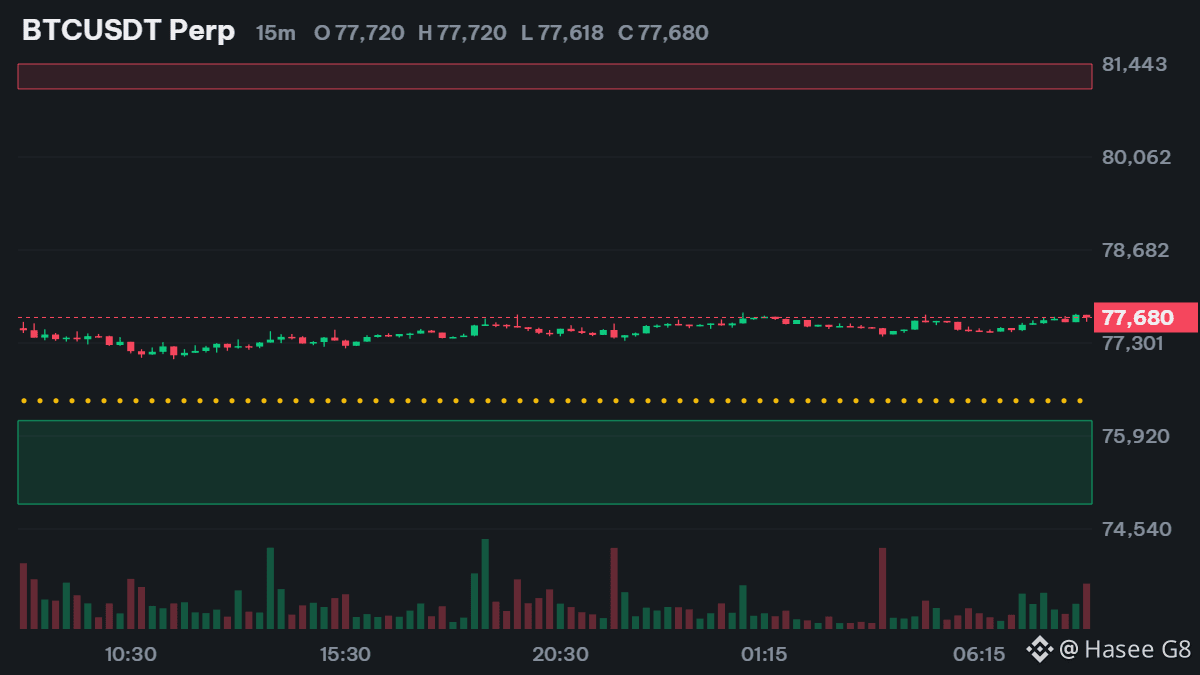
$BTC - the chart's doing most of the talking today, so I'll be brief.
Demand at 74,909 – 76,149, about 1.8% under spot — close enough that a normal dip could tag it. Sell zone: 81,073 – 81,954, midpoint 81,514. If price pushes into it, that midpoint is where the first rejection usually shows.
Liquidity above: 84,875. Nothing has traded through that level yet, and untouched highs act like magnets.
Timeframes are mixed right now — no clean alignment. That's a wait-for-the-level market, not a chase-the-candle market.
Trade here 👇