
🚨 CRYPTO FUNDING FEE ALERT: BTC AND ETH SHOW OPPOSITE SIGNALS! 📊
As a crypto trader and market analyst, I look beyond price movements to understand what’s happening in the perpetual futures market. This Funding Fee Settlement Dashboard reveals an interesting difference between major assets.
🟢 BTC Leads the Settlement Map
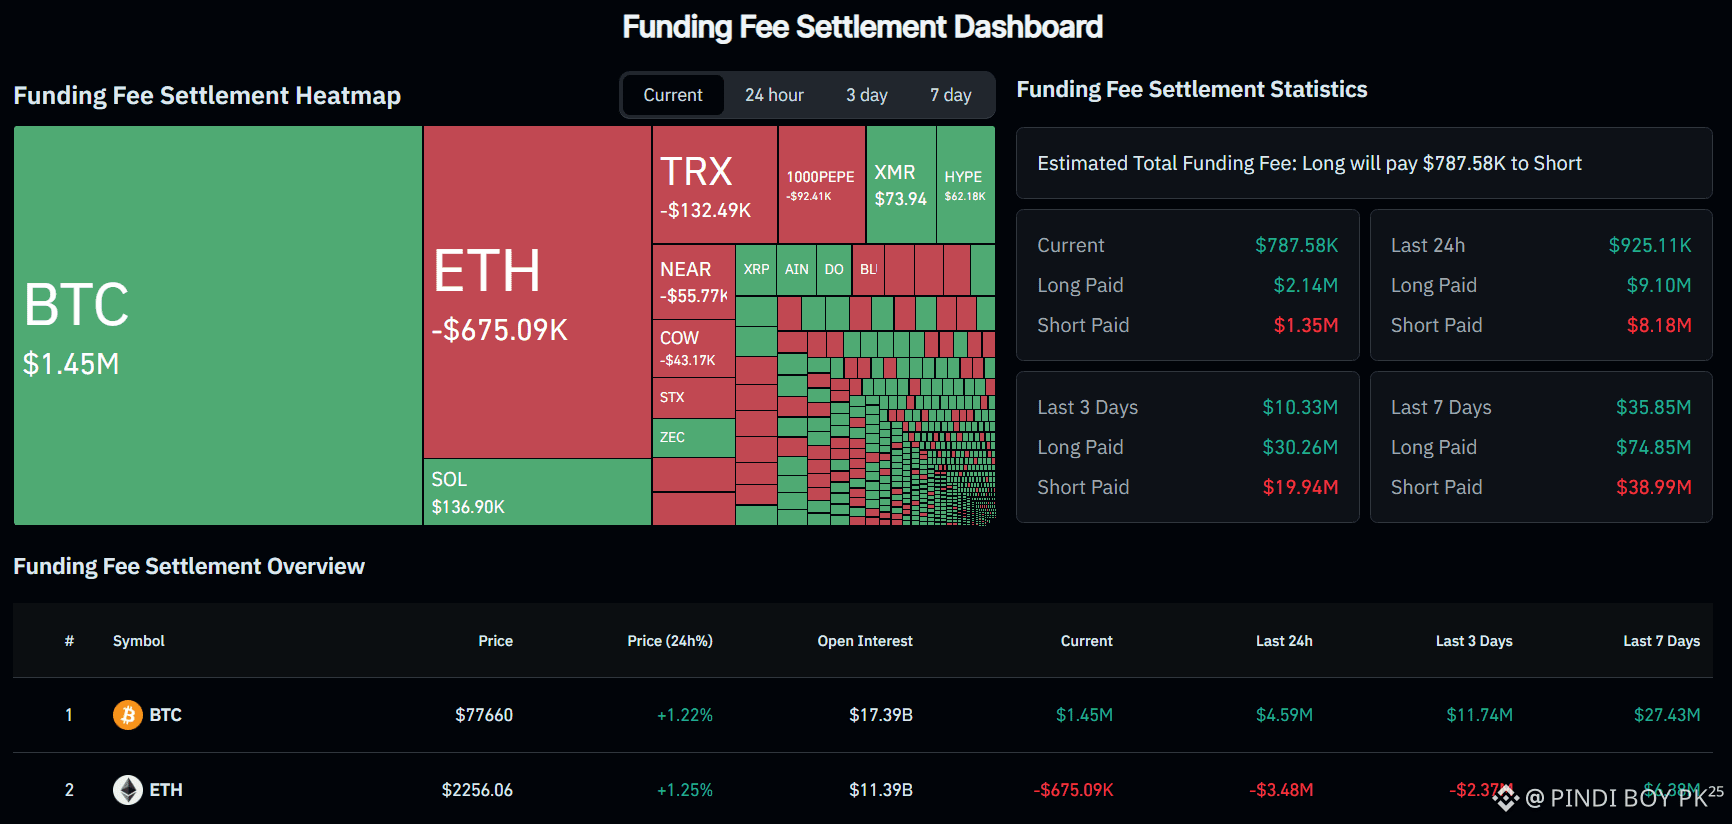
Bitcoin shows approximately $1.45M in current funding settlements, while its price is around $77,660, up 1.22% over 24 hours. This indicates substantial funding payments associated with BTC positions in the displayed snapshot.
🔴 ETH Shows the Opposite Picture
Ethereum records approximately -$675.09K, despite its price being up 1.25% to $2,256.06. This contrast highlights why price performance alone cannot explain derivatives positioning.
📊 The Bigger Picture
Across the dashboard, estimated current funding settlements total $787.58K. The displayed seven-day figures show $35.85M in total settlements, with $74.85M paid by longs and $38.99M by shorts.
⚠️ My Trading Takeaway: Funding payments can reveal positioning pressure, but they don't guarantee a reversal or continuation. I would combine funding rates with open interest, price action, and liquidation data before making a decision.
Are traders getting too comfortable on one side, or is this simply normal market positioning?
#bitcoin #Ethereum #FundingRates #cryptotrading #Derivatives
$BTC
$ETH
$STX
As a crypto trader and market analyst, I look beyond price movements to understand what’s happening in the perpetual futures market. This Funding Fee Settlement Dashboard reveals an interesting difference between major assets.
🟢 BTC Leads the Settlement Map
Bitcoin shows approximately $1.45M in current funding settlements, while its price is around $77,660, up 1.22% over 24 hours. This indicates substantial funding payments associated with BTC positions in the displayed snapshot.
🔴 ETH Shows the Opposite Picture
Ethereum records approximately -$675.09K, despite its price being up 1.25% to $2,256.06. This contrast highlights why price performance alone cannot explain derivatives positioning.
📊 The Bigger Picture
Across the dashboard, estimated current funding settlements total $787.58K. The displayed seven-day figures show $35.85M in total settlements, with $74.85M paid by longs and $38.99M by shorts.
⚠️ My Trading Takeaway: Funding payments can reveal positioning pressure, but they don't guarantee a reversal or continuation. I would combine funding rates with open interest, price action, and liquidation data before making a decision.
Are traders getting too comfortable on one side, or is this simply normal market positioning?
#bitcoin #Ethereum #FundingRates #cryptotrading #Derivatives
$BTC
$ETH
$STX