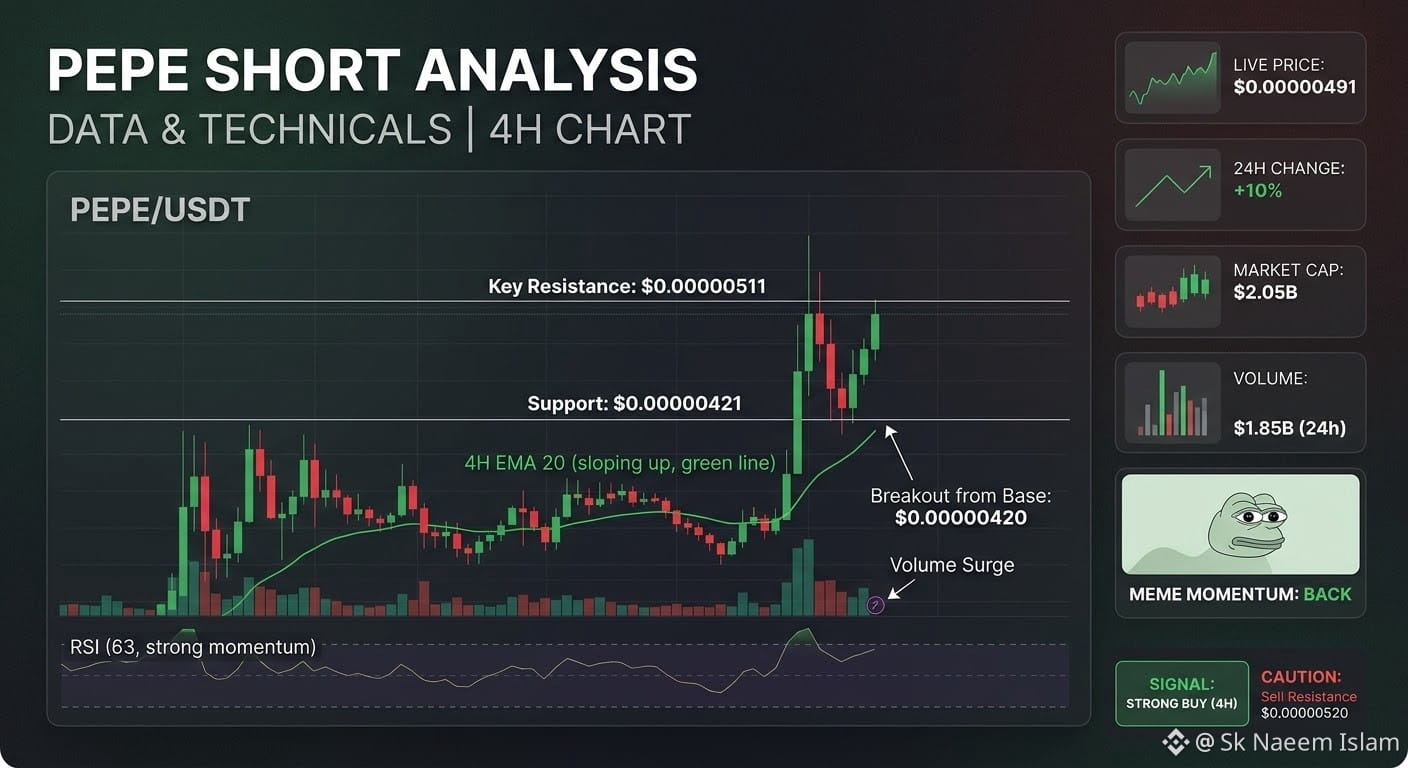
$PEPE trades around $0.0000049, reflecting a consolidation and high-volatility phase typical of major meme tokens. Analyzing its price action through a standard candlestick chart framework reveals several key technical dynamics:
1. Candlestick Structure & Price Action
Short-Term Consolidation & Wicks: Recent daily and 4-hour candles show tight bodies with extended upper and lower wicks. This points to an active tug-of-war between buyers stepping in on intraday dips and profit-taking whales selling near local resistance levels.
Intraday Range: The asset has maintained a 24-hour band stretching from a low near $0.00000437 up to a high of $0.00000565. Long lower wicks on recent sessions indicate that buyers are aggressively defending the lower boundary of this range, preventing deeper pullbacks.
2. Key Technical Levels
Immediate Support ($0.00000430 – $0.00000440): Aligns with the recent intraday lows. A decisive daily candle close below this zone could signal a bearish continuation toward lower structural supports.
Immediate Resistance ($0.00000520 – $0.00000565): Represents the upper ceiling of the current congestion zone. A strong bullish candle body breaking and closing above $0.00000565 with high volume would signal a shift in momentum toward an aggressive breakout.
3. Volume and Momentum
Volume Profile: Trading volume remains high (averaging over $1.7B), keeping PEPE deeply liquid. However, flat or slightly declining volume alongside tight candlestick bodies indicates market participants are waiting for a clearer directional catalyst—often correlated with broader macro movements in Bitcoin or overall market sentiment.#BinanceWillListPredictPREDICT #UniswapA16zSeekDeFiExemptionFromIllinoisCryptoTax #USMidtermElections #AmazonSharesFallAbout7%InPremarketTrading $PEPE