🚀 $SOL BUY SIGNAL 📈 | Bulls Are Taking Control!
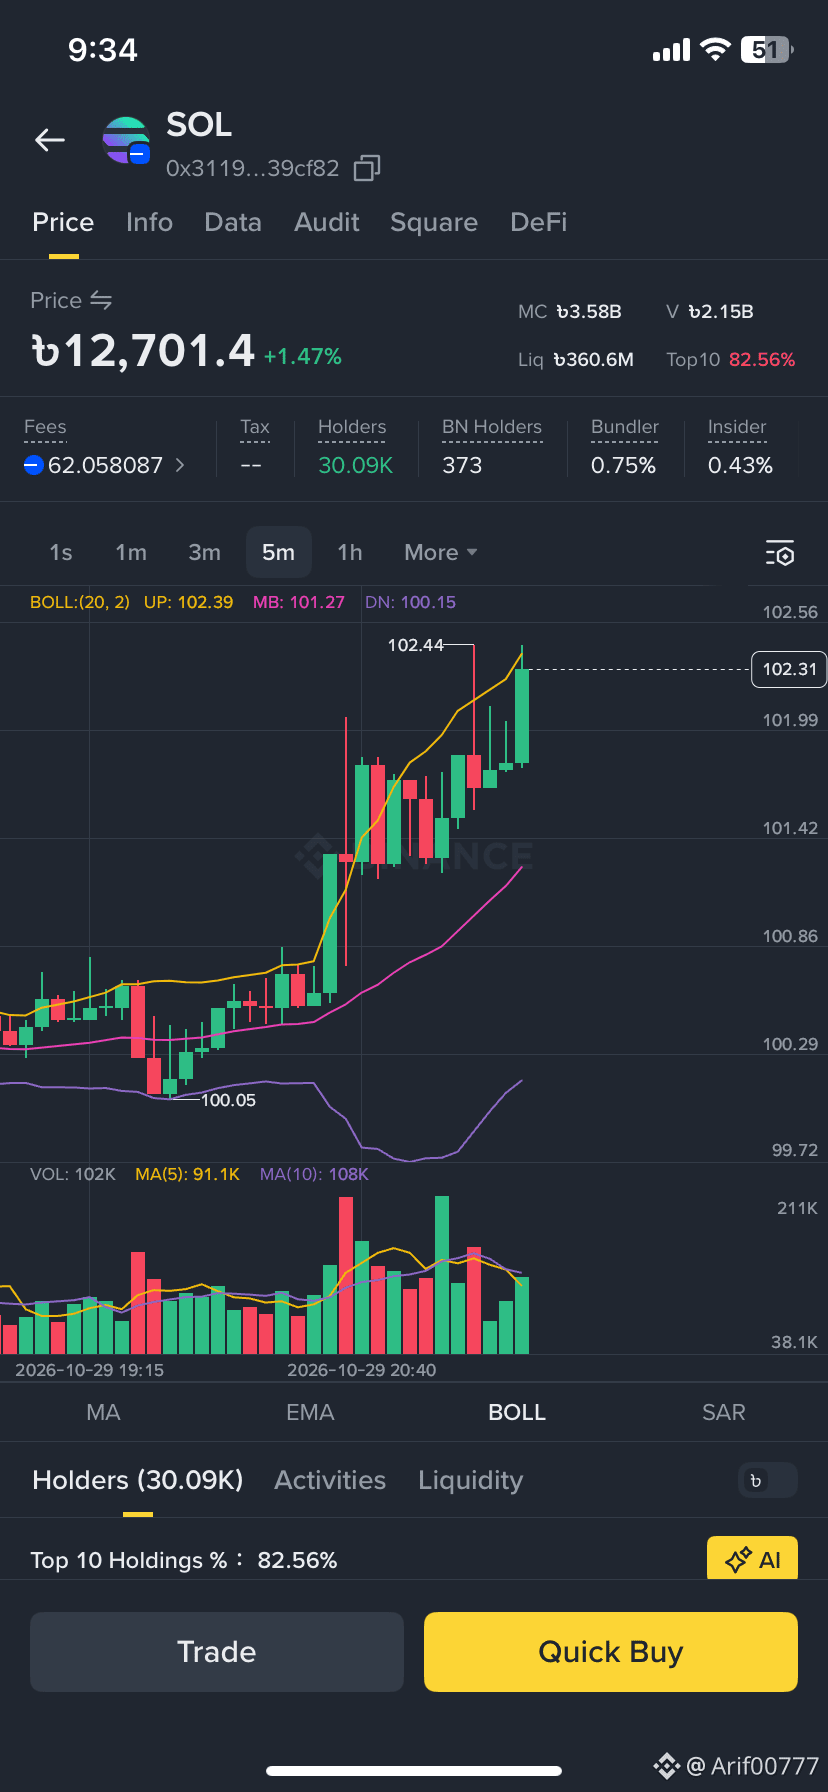
$SOL is showing strong bullish momentum on the 5-minute chart! After bouncing from the 100.05 area, buyers pushed the price toward 102.44, with several strong green candles indicating increasing buying pressure.
However, $SOL is now trading near the upper Bollinger Band, so a short-term pullback is possible. Here’s the setup I’m watching 👇
🟢 Trade Setup: LONG / BUY
📍 Entry Zone: 101.70 – 102.00
✅ Breakout Entry: Above 102.45 after a confirmed breakout
🎯 Take Profit 1: 102.70
🎯 Take Profit 2: 103.00
🎯 Take Profit 3: 103.50
🛑 Stop Loss: 101.30
📊 Technical Analysis
• Strong upward movement from the 100.05 low.
• Price is trading above the Bollinger middle band, showing bullish short-term momentum.
• The 102.44 level is the key resistance to watch.
• A breakout with strong volume could open the door to further upside.
• If price loses the 101.70 area, a deeper pullback may occur.
⚠️ My Strategy: I would avoid chasing the current green candle. I’d prefer either a pullback into the entry zone or a confirmed breakout above 102.45 with strong volume.
This analysis is based on the screenshot’s 5-minute chart. Confirm the live price and market conditions before entering.
💬 What’s your move on SOL? Are you buying the dip or waiting for a breakout?
#SOL #Solana #CryptoTrading #TradingSignals #TechnicalAnalysis