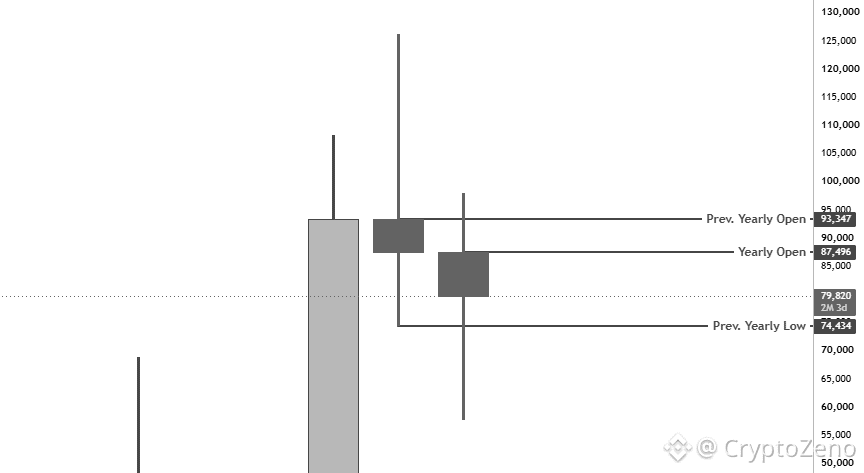
$BTC This yearly candle is important.
My base scenario was that we would deviate above the yearly open and tap 93.6k before retracing back below 87.4k and closing the yearly candle in red.
Then, when the 2027 yearly candle opens, it would first fill some of the wick of the current year's candle, where we'd get a retest of the 74.5k region before continuing towards the upside.
Now, Putting a Wave Count on this thesis, It would look something like this:
Deviation above 93k = Monthly Wave 1.
Yearly close below 87.4k, making the candle close in red.
The 2027 candle fills some of the wick of the 2026 candle = Monthly Wave 2 around the 74k region.
Following that wick fill, We pump towards the upside inside Wave 3 and create a new ATH.
This was my overall time, price + liquidity thesis behind the Wave Count I'm tracking on the Weekly/Monthly, and it's still pretty much valid as long as we keep holding the 0.618 Fib and the trendline on the Daily.
However, The catch is that if we lose that 0.618 Fib / trendline on the Daily and actually complete Wave 2 in the start of next month, It would change the timeline significantly.
Meaning that the imbalance which should ideally be cleared by next year's candle would instead be filled during the current yearly session.
Now, Given that we have liquidity stacked above the yearly open as of now, A tap into the 76k-74k region for completing Wave 2 within this year would mean we're likely to pump for the rest of Q4 and close the yearly candle in green, potentially around the 93.3k region.
From there, The next yearly candle would only come down to the 87.4k region for a minor retest before continuing higher.
So if we complete the Weekly Wave 2 in the upcoming days, It would mean we're setting up for a bigger impulse before the end of the year, and November-December could take us into the 93k-96k region.