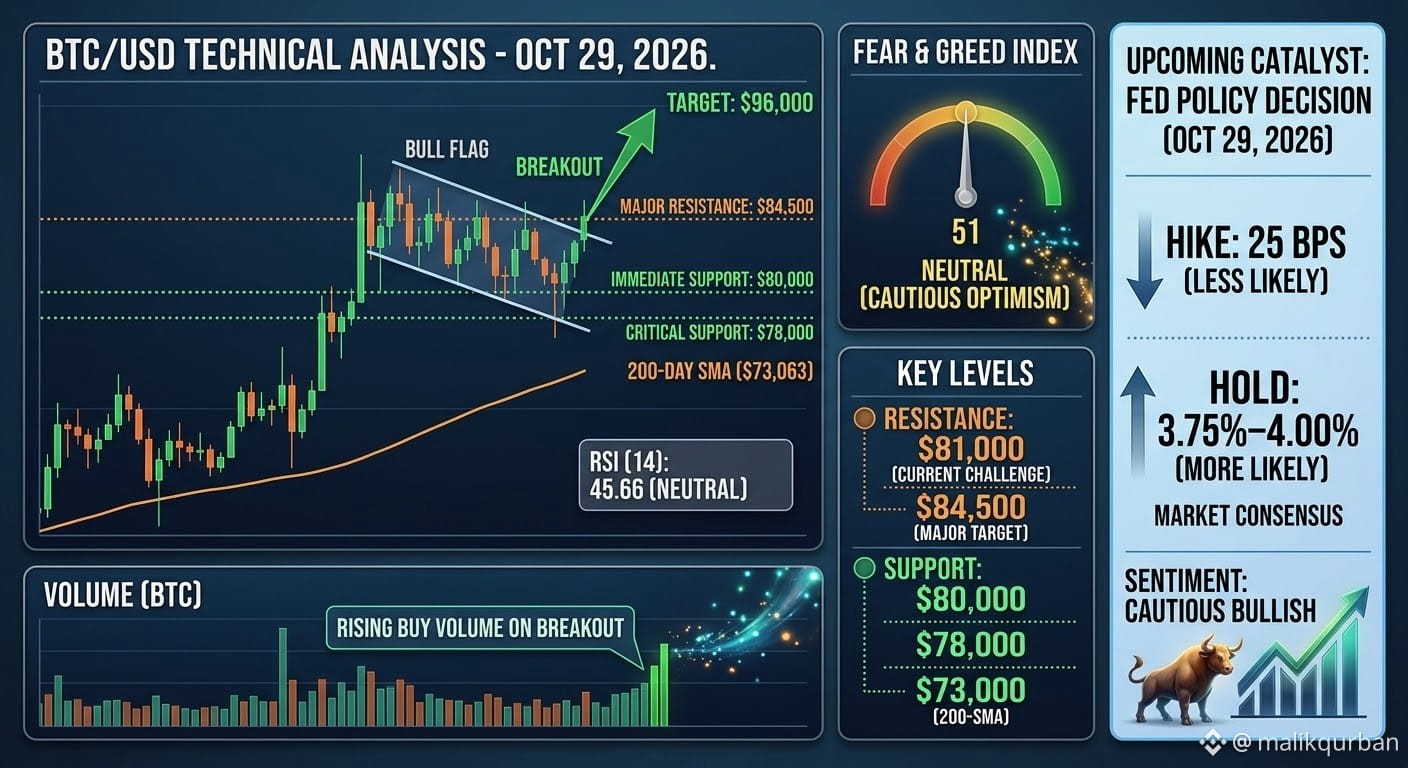
bb$BTC is currently trading around a critical psychological level, showing both signs of strength and necessary consolidation. The market, reflecting a 'neutral' sentiment on the 'Fear & Greed Index,' is in a state of watchful anticipation, primarily driven by external macroeconomic factors and internal technical indicators. The provided analysis breaks down the essential components that are shaping the near-term price action.
1. Technical Analysis: The Battle at $81,000 Resistance
The primary graphic, a BTC/USD TECHNICAL ANALYSIS candlestick chart from August to October 2026, illustrates a distinct upward trend culminating at a major resistance level of $81,000. As labeled, this is a "MAJOR RESISTANCE" point. The price is currently testing this level, highlighted by red down-arrows indicating selling pressure. A decisive break above $81,000 could lead to a renewed bullish phase, while failure to overcome it may result in further accumulation or a correction.
#bitcoin #Crypto_Jobs🎯