

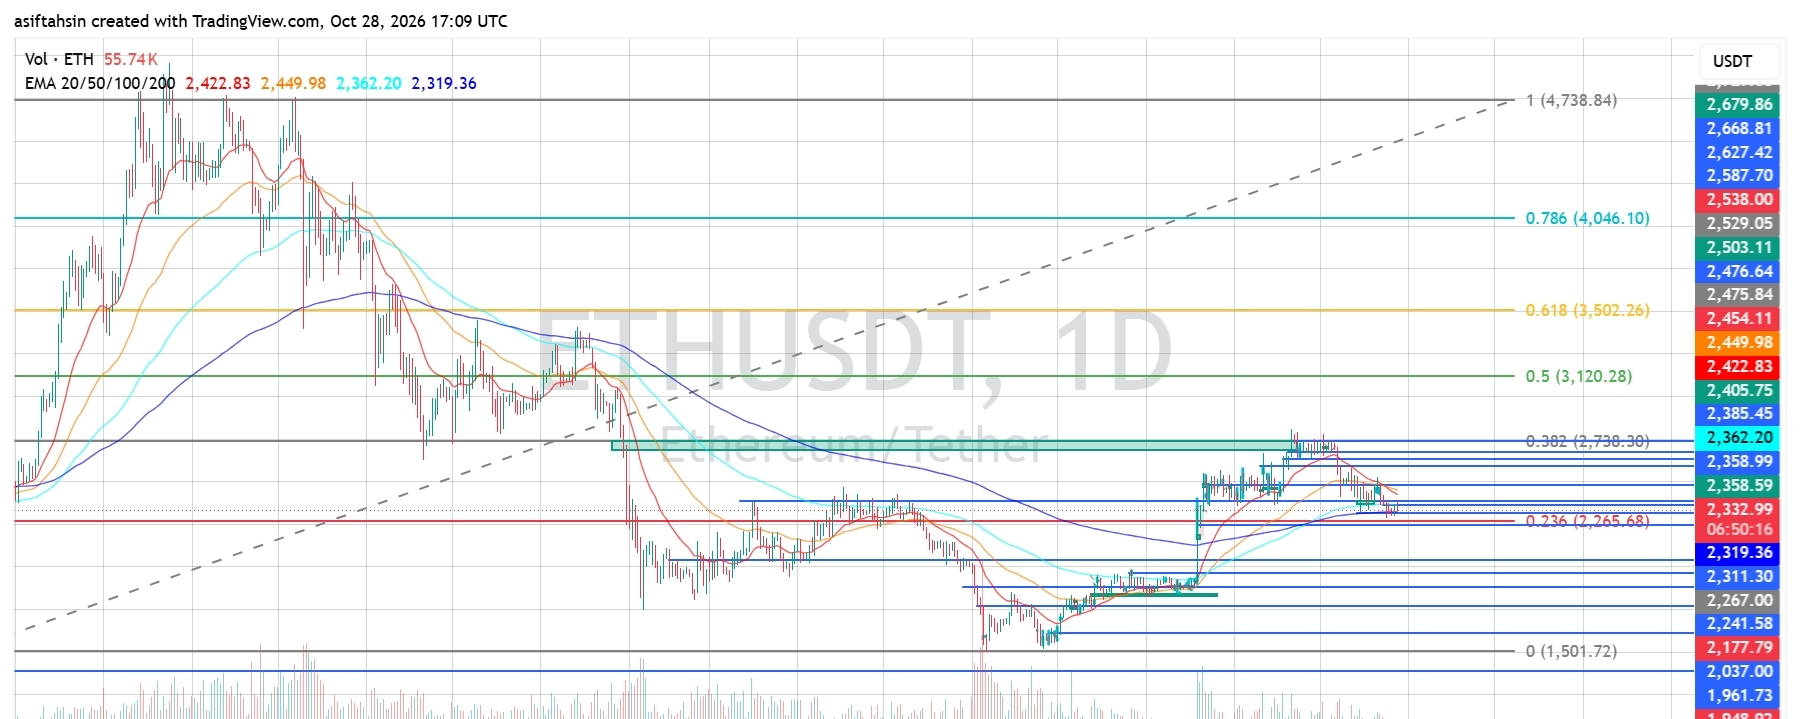

Ethereum (ETH) is trading around $2,333 after facing rejection from the $2,385–$2,420 resistance region. Following a strong recovery from the June low near $1,501, ETH has lost short-term momentum and is now testing an important support area.
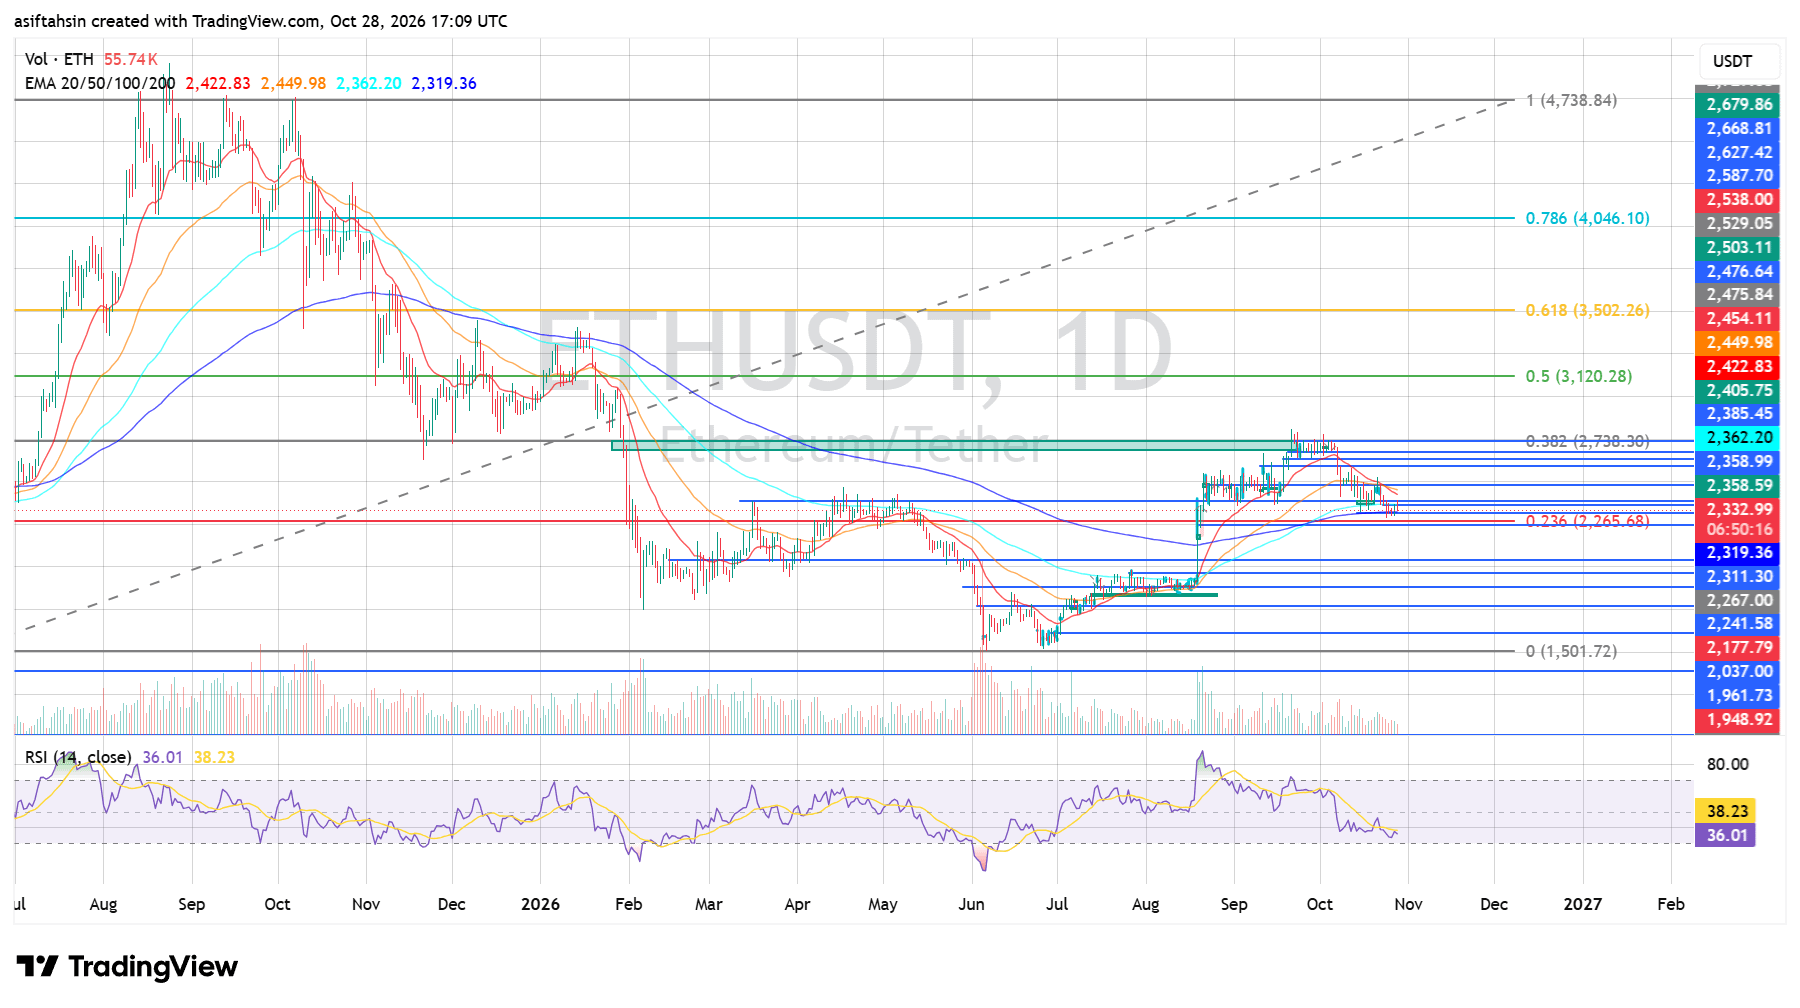
Price is trading below the 20 EMA and 50 EMA, while RSI has dropped to 36.01, indicating increasing bearish pressure. The key question is whether buyers can defend the $2,300–$2,265 region or sellers push ETH toward lower support levels.
📈 EMA Structure
🔹 20 EMA: $2,422.84
🔹 50 EMA: $2,449.99
🔹 100 EMA: $2,362.21
🔹 200 EMA: $2,319.36
ETH is trading below all four EMAs except that price is currently close to the 200 EMA region. This reflects a weak short-term structure, with the 100 EMA and 200 EMA acting as important nearby reference levels.
A sustained recovery above $2,362 would be an early sign of improvement. Reclaiming $2,422–$2,450 would provide stronger evidence that bullish momentum is returning.
📐 Fibonacci Levels
🔹 0: $1,501.72
🔹 0.236: $2,265.68
🔹 0.382: $2,738.30
🔹 0.5: $3,120.28
🔹 0.618: $3,502.26
🔹 0.786: $4,046.10
🔹 1.0: $4,738.84
ETH is trading above the 0.236 Fibonacci level near $2,265.68, which is an important support reference. Holding above this level could help buyers stabilize price, while a confirmed breakdown could expose lower support zones.
The 0.382 Fibonacci level near $2,738.30 remains a major upside reference if ETH stages a sustained recovery.
🟢 Bullish Scenario
Immediate resistance is around $2,358–$2,385, followed by the 20 EMA near $2,422.84.
Potential upside targets:
🎯 $2,358–$2,385
🎯 $2,422–$2,450
🎯 $2,476–$2,503
🎯 $2,529–$2,588
🎯 $2,627–$2,679
🎯 $2,738
Reclaiming $2,362 would be an early sign of recovery. A stronger move above $2,422–$2,450 could improve the short-term structure and open the way toward $2,503.
If buying pressure continues and ETH breaks above $2,588, the $2,627–$2,679 zone could become the next potential target, followed by the $2,738 Fibonacci resistance.
🔴 Pullback Scenario
Key support levels:
⚠️ $2,333–$2,319
⚠️ $2,311–$2,267
⚠️ $2,241–$2,177
⚠️ $2,037
⚠️ $1,961–$1,948
ETH is testing the area around its 200 EMA near $2,319. A sustained breakdown below this region could bring $2,311–$2,267 into focus.
If sellers push price below $2,265.68, the recovery structure would weaken further, exposing the $2,241–$2,177 support zone.
Continued selling pressure could eventually bring $2,037 and the $1,961–$1,948 region into consideration.
🧠 Market Structure & Liquidity
Recovery → Resistance Rejection → Pullback → Support Test → Potential Bounce or Breakdown
ETH recovered strongly from its June low near $1,501 and rallied toward the $2,385–$2,420 region. However, the recent rejection has brought sellers back into control in the short term.
The $2,319–$2,362 region is the immediate decision zone. Holding support and reclaiming the 100 EMA could support a recovery toward $2,422 and $2,450.
On the other hand, losing the $2,319 area could expose the $2,311–$2,265 support region.
📊 RSI Momentum
🔹 RSI: 36.01
🔹 RSI MA: 38.23
RSI is below 50 and below its moving average, confirming weak momentum. The indicator is approaching oversold territory, but this does not guarantee an immediate reversal.
A recovery above 40–45, supported by a price reclaim of $2,362, would suggest improving momentum. Continued weakness alongside a breakdown below $2,319 could increase downside pressure.
🎯 Key Levels
Resistance: $2,358 → $2,385 → $2,422 → $2,450 → $2,503 → $2,529 → $2,588 → $2,627 → $2,679 → $2,738
Support: $2,333 → $2,319 → $2,311 → $2,267 → $2,241 → $2,177 → $2,037 → $1,961 → $1,948
📌 Final Outlook
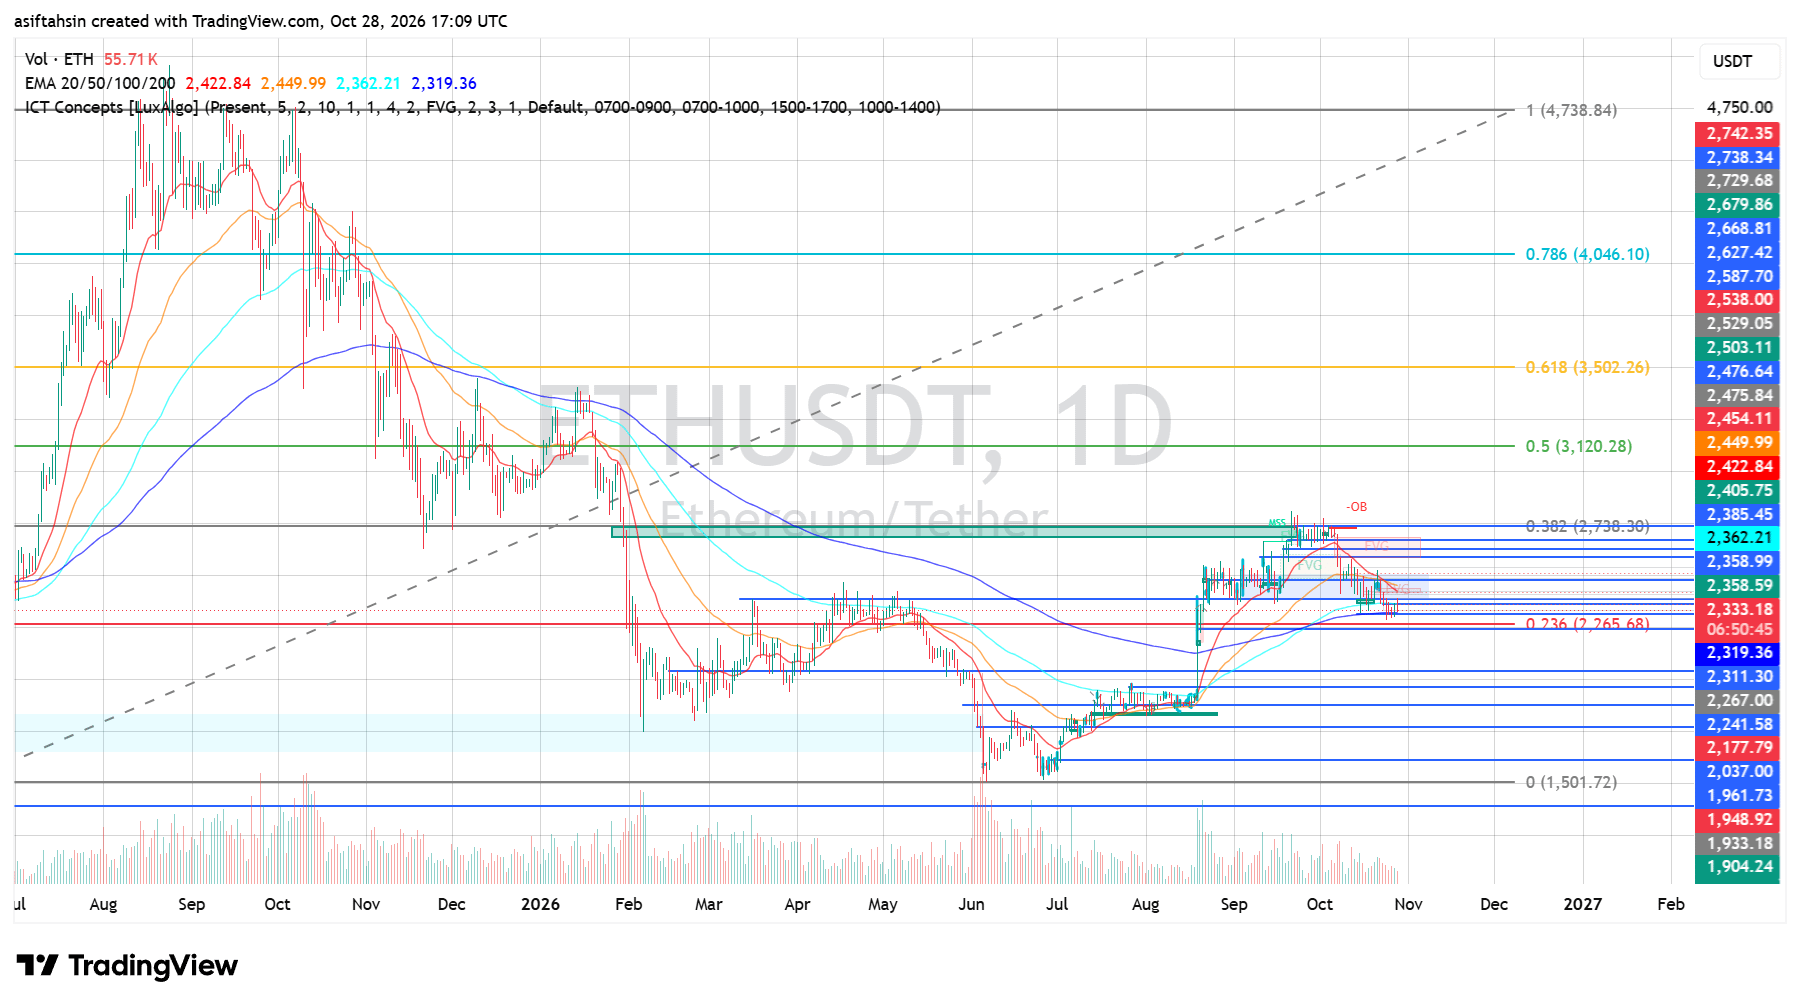
ETH's short-term structure has weakened below the 20 EMA and 50 EMA, with RSI at 36.01 reflecting persistent selling pressure.
The immediate battle is around $2,319–$2,362. Holding this zone could support a recovery toward $2,422 and $2,450. A sustained breakout above $2,450 would provide stronger evidence of a bullish recovery.
On the downside, losing $2,319 could expose $2,267, with $2,241 and $2,177 as further support references.
Bias: Short-term bearish below $2,422–$2,450. Holding $2,265–$2,319 could allow a relief bounce, while a confirmed breakdown below $2,265 would increase downside risk.
