$EVAA LIQUIDATION MAP — WHICH SIDE GETS WIPED OUT NEXT?
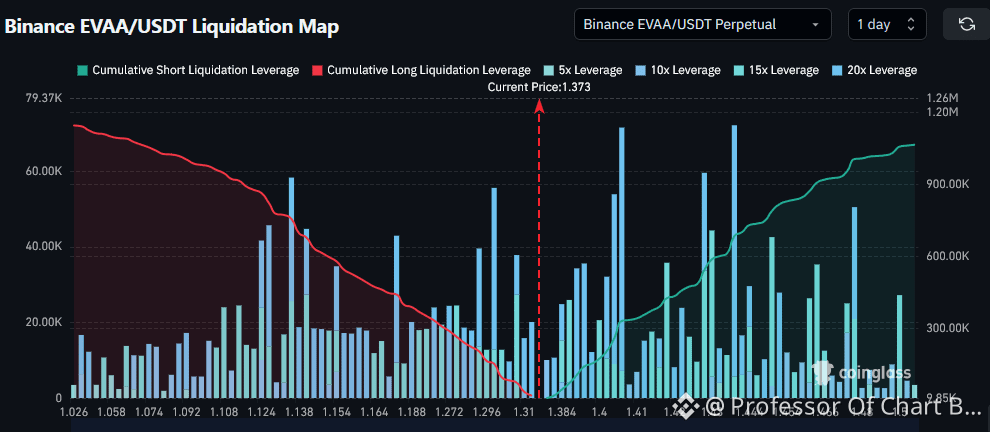
$EVAA is trading around $1.373, and the liquidation map shows liquidity building on both sides.
Above price, major short liquidation clusters sit around $1.40–$1.44, with more liquidity extending toward $1.50.
Below price, long liquidations are concentrated around $1.30–$1.32.
But here’s what makes this setup interesting: funding rates are dropping, while longs are still paying heavily to hold their positions.
If price pushes higher, short liquidations could fuel another move. But if buying momentum fades, crowded longs could face pressure toward the lower liquidation zone.
#EVAA