$NVDA
4H: Critical Support Hold – Breakout or Breakdown Ahead?
━━━━━━━━━━━━━━━━━━━━
Market Overview
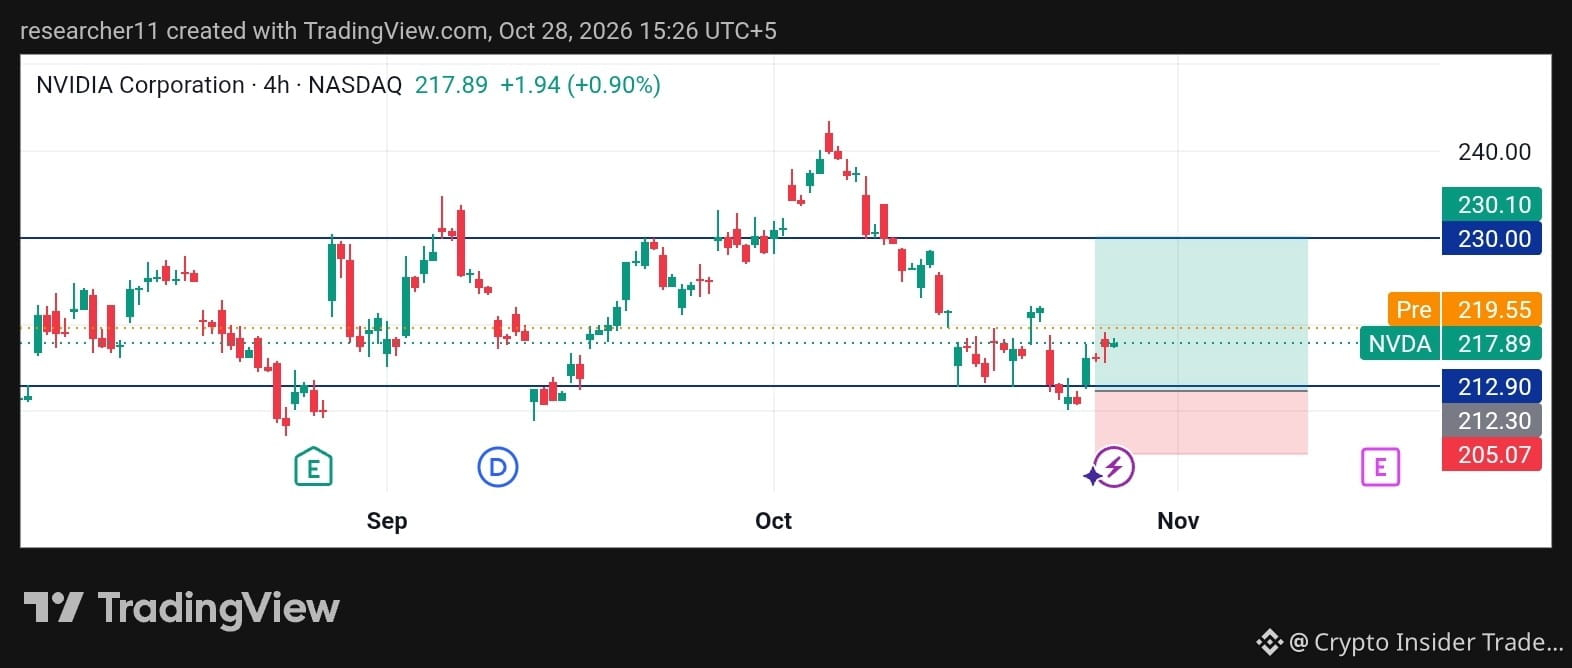
NVIDIA sits at 217.89 (+0.90%) on the 4H chart after a sharp rejection from the 240 zone. Price is coiling near the mid-range with clear compression forming into early November.
━━━━━━━━━━━━━━━━━━━━
Technical Structure
Recent price action shows a failed push above 230 followed by a controlled pullback. The market is now testing the 212.90–212.30 demand zone. A strong horizontal resistance remains at 230.00–230.10. Structure is currently neutral-to-slightly bullish as long as the lower boundary holds.
━━━━━━━━━━━━━━━━━━━━
Key Levels
➤ Resistance: R1 219.55 | R2 230.00–230.10
➤ Support: S1 212.90–212.30 | S2 205.07
━━━━━━━━━━━━━━━━━━━━
Scenario Analysis
🟢 Bullish Case: Clean hold above 212.90 with a 4H close back above 219.55 opens the path toward 230. Volume expansion on the bounce would confirm strength.
🔴 Bearish Case: Decisive break and close below 212.30 risks acceleration toward 205.07. Failure to reclaim 219.55 keeps sellers in control.
⚪ Neutral Case: Continued range-bound action between 212.30–219.55 until a clear directional candle appears.
━━━━━━━━━━━━━━━━━━━━
Outlook
Traders should watch the 212.90–219.55 zone closely. A high-volume break either side will likely set the tone for the next swing. Stay focused on price confirmation rather than anticipation.
#NVDA #NVIDIA #CanMicrosoftDeliverOnAI #CanGoogleDefindItsCore #EarningsSeason