$ACU.US Breaks 0.12 and Surges Toward 0.137 — Is the Rally Overextended?
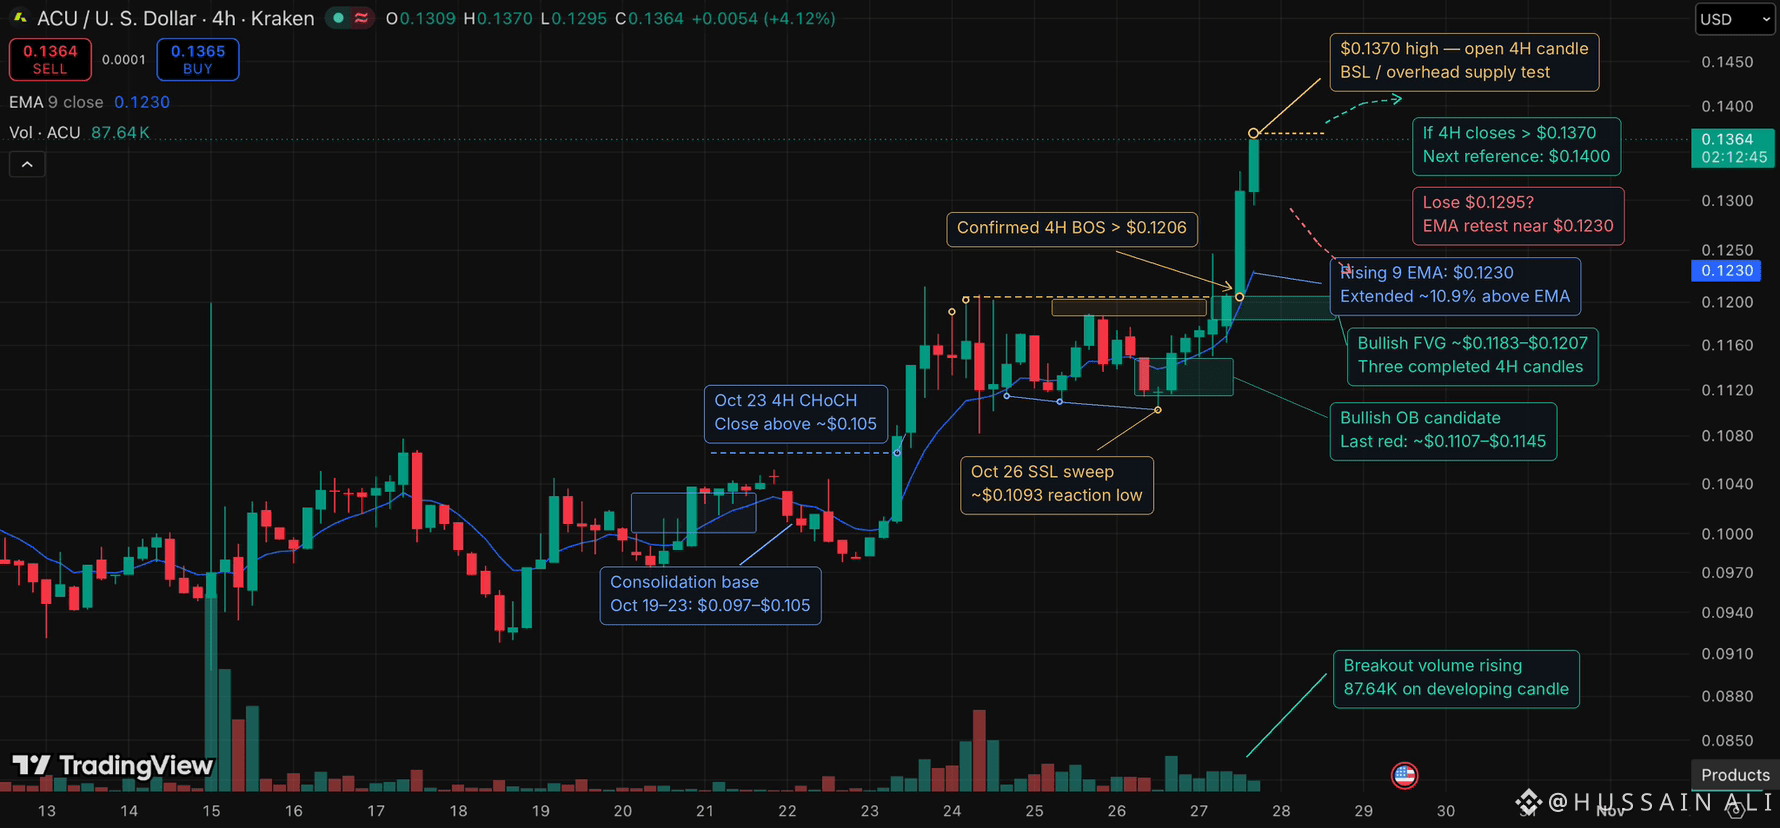
ACU is trading around 0.1364, and the 4H chart has changed significantly.
What was resistance at 0.118–0.121 has now been broken with strong bullish candles and rising volume.
The recent Break of Structure (BOS) confirms improving momentum. Buyers are also holding price well above the 9 EMA at 0.1230.
But something deserves attention.
ACU is already nearly 11% above its 9 EMA. That's a strong move, but it also increases the risk of a short-term pullback.
I'm watching 0.137 closely.
A confirmed 4H close above this level could open the way toward 0.140.
If buyers lose momentum, 0.123 becomes an important dynamic support. Below that, the bullish FVG around 0.1183–0.1207 could attract a retest.
My read is that the market structure has turned bullish, but chasing a vertical move carries risk.
I'd rather see ACU consolidate above its previous resistance than immediately give back the breakout.
Can buyers turn 0.12 into a solid support base?
Ref r9bq1q