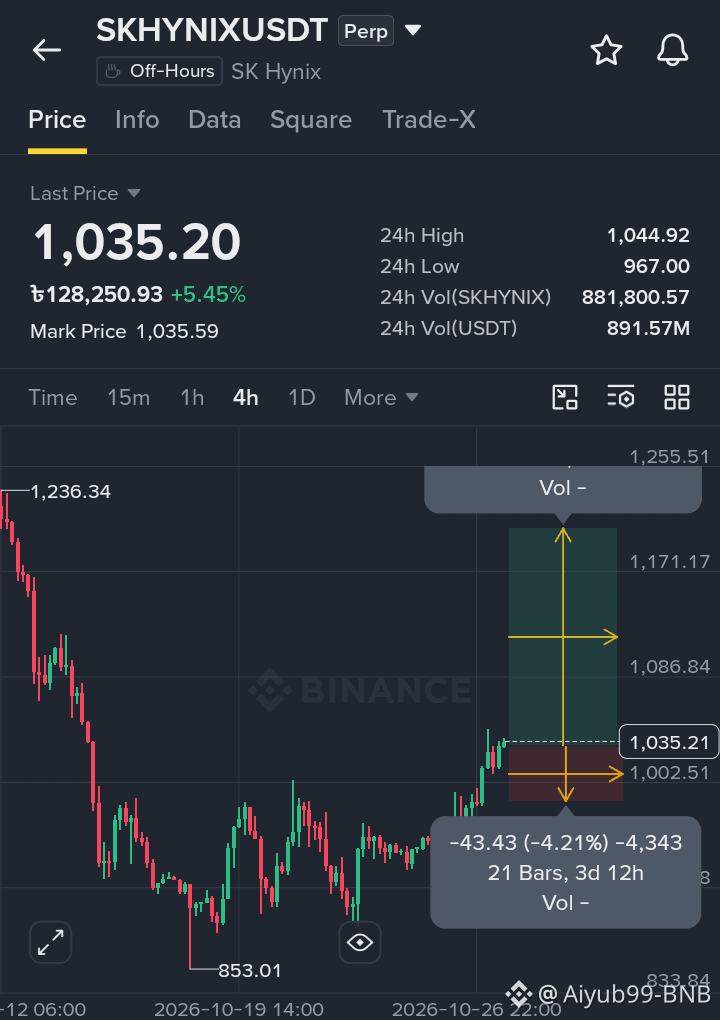
$SKHYNIX UP +5.45% 🔥 Bullish Momentum Is Building, But Watch These Key Levels!
Entry plan : 1030-1035.5
Tp: 1040-1050-1060
SL: 1000
SK Hynix is showing strong price movement, and the 4H chart reveals a recovery from recent lows. But can the bullish momentum continue, or will sellers step in near resistance?
📊 MARKET OVERVIEW 🔹 Trading Pair: SKHYNIXUSDT 🔹 Contract: Perpetual (Perp) 🔹 Current Price: 1,035.20 USDT 🔹 Mark Price: 1,035.59 USDT 🔹 24H Change: +5.45% 🔹 24H High: 1,044.92 USDT 🔹 24H Low: 967.00 USDT 🔹 24H Volume (SKHYNIX): 881,800.57 🔹 24H Volume (USDT): 891.57M
📈 4H CHART ANALYSIS
The chart shows a recovery from the recent low of 853.01, followed by a series of upward movements.
Price is now trading around 1,035, approaching the recent 24-hour high of 1,044.92.
Here are the key levels to watch:
🟢 Support Zone: Around 1,002.51 🔴 Immediate Resistance: 1,044.92 🎯 Potential Upside Area: 1,086.84 🚀 Higher Resistance Zone: Around 1,171.17
⚠️ These are chart reference levels, not guaranteed targets. A breakout above resistance with strong volume could support further upside, while rejection may lead to a pullback.
🧠 MY MARKET VIEW
The short-term structure looks constructive after the recovery from 853.01. However, price is approaching resistance, so chasing the move without confirmation could be risky.
✅ A sustained move above 1,044.92 could strengthen the bullish case. ⚠️ A drop below 1,002.51 could weaken the current momentum.
📢 TRADERS, WHAT'S YOUR VIEW?
Will SKHYNIXUSDT break above 1,045 and move toward 1,086—or will the price pull back first?
👇 Comment your analysis: BULLISH 🟢