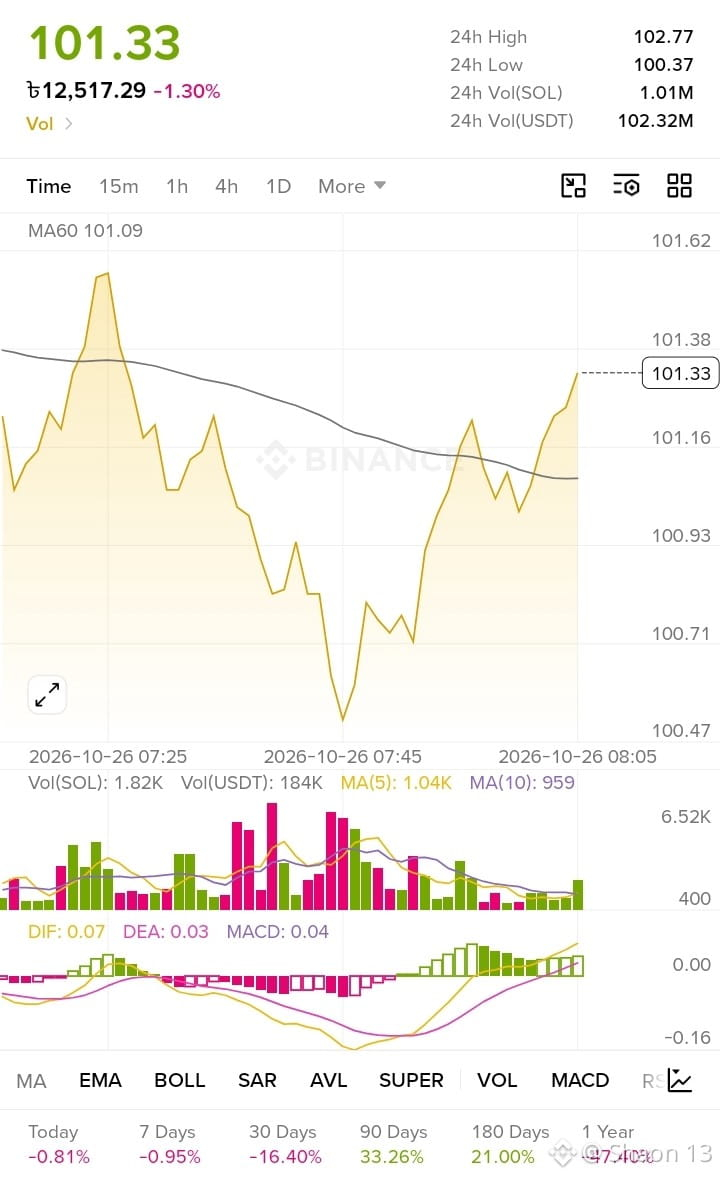
Title: 🚀 SOL/USDT Technical Analysis: Price Action & Market Sentiment Update!
Hello Binance Square Family! 👋 Let's take a quick look at the latest performance and market data for SOL/USDT.
📊 Current Market Overview:
Current Price: $101.33 USDT
24h High / Low: $102.77 / $100.37
24h Volume (SOL): 1.01M
24h Volume (USDT): 102.32M
Moving Average (MA60): Hovering around $101.09, showing a critical pivot zone for short-term price direction.
MACD Indicator: DIF, DEA, and MACD indicators are displaying interesting momentum shifts as the price interacts with the moving averages.
📈 Performance Overview:
Today: -0.81%
7 Days: -0.95%
30 Days: -16.40%
90 Days: +33.26%
180 Days: +21.00%
1 Year: -47.40%
Solana is currently testing key support and resistance levels near the $101 mark, balancing short-term dips with solid medium-term gains (+33.26% over 90 days).
💡 Trading Strategy & Insights:
Support & Resistance: Watch the $100-$101 zone closely as a crucial psychological and technical support level.
Volume & Momentum: With over 102M USDT in 24h volume, liquidity remains healthy for active traders.
Risk Management: Market conditions fluctuate, so always do your own research (DYOR) and manage your risk properly before executing trades.
📌 What are your price predictions for Solana (SOL) this week? Are you buying the dip or waiting for a breakout? Share your thoughts in the comments! 👇
#SOL空投 #Solana #BinanceSquare #CryptoTrading. #Altcoins #TechnicalAnalysis
$LLYB $MSFTB $TSMB #USDT