

Bullish breakout alert
1,259–1,262
A 15-minute candle closes above resistance with increasing volume. This would strengthen the continuation setup.
Pullback / support alert
1,238–1,242
Watch whether buyers defend the MA(25) area. A bullish rejection here may offer a better entry.
Bearish warning
1,233–1,234
A decisive close below this nearby support would weaken the short-term bullish structure.
Deeper support alert
1,224–1,226
Near MA(99). If price loses this area, downside risk toward 1,209 and 1,199 increases.
Trend structure — bullish recovery
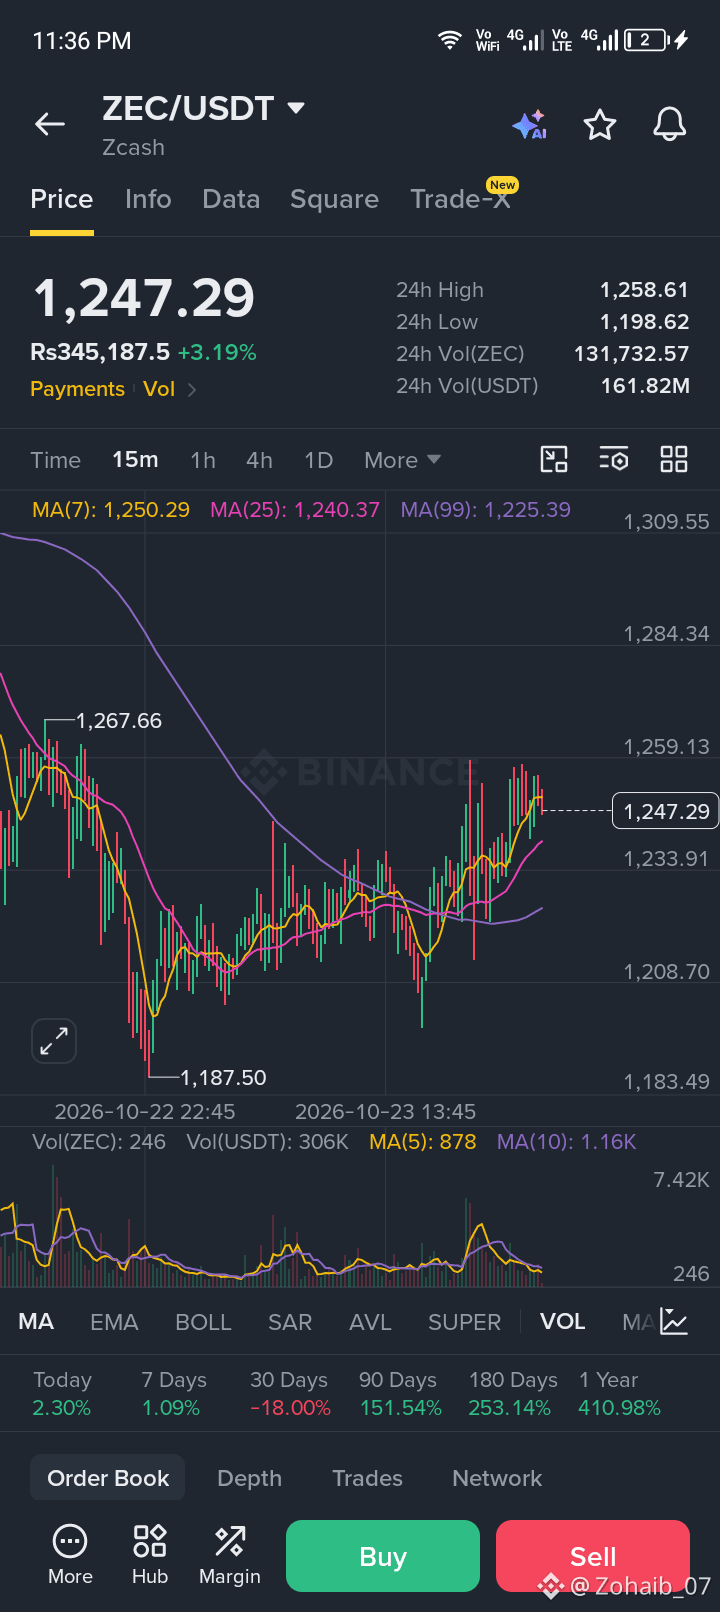
ZEC has recovered from the marked swing low near 1,187.50 and is trading above MA(25) at 1,240.37 and MA(99) at 1,225.39. This supports a recovery bias, although it does not confirm a sustained higher-timeframe uptrend.
Resistance — 1,250 to 1,259
MA(7) is at 1,250.29, slightly above the shown price. Recent candles also approached the 24-hour high of 1,258.61 and struggled to push through. Sellers may defend this region.
Support — 1,238 to 1,242
This is near MA(25) and is a potential area for a retest. Below it, 1,233–1,234 is an additional visible chart level, followed by MA(99) near 1,225.
Volume — confirmation is needed
The chart shows a recent increase in volume during the advance, followed by lower activity in the latest bars. That may indicate momentum cooling. A new volume expansion is desirable for a breakout; declining volume alone does not prove a reversal.
Setup A — Buy the pullback
Strategy: Support retest and bullish reversal
Entry zone
1,238–1,242
Stop-loss
1,229
Take-profit 1
1,253
Take-profit 2
1,259
Entry confirmation
Price retests the 1,238–1,242 zone.
A 15-minute candle rejects lower prices and closes bullish.
Buying volume improves rather than fading.
Invalidation: Avoid the long if price breaks support decisively. The stop-loss is below the proposed entry zone, but a fast market can fill below the stop.
Setup B — Breakout long
Strategy: Resistance breakout followed by a successful retest
Entry trigger
1,260–1,263
Stop-loss
1,249
Take-profit 1
1,275
Take-profit 2
1,284
Entry confirmation
A 15-minute candle closes above the 1,258.61 high.
Volume expands on the breakout.
Price retests the breakout area and holds it as support.
Invalidation: A breakout that immediately falls back below 1,258 can be a bull trap. Avoid chasing a large green candle without a retest.
Setup C — Breakdown short
Strategy: Breakdown and bearish retest
Entry zone
1,231–1,234
Stop-loss
1,244
Take-profit 1
1,225
Take-profit 2
1,209
Entry confirmation
Price closes below 1,233–1,234 on the 15-minute chart.
A retest fails to reclaim that zone.
Selling volume expands as price falls.
Invalidation: If price reclaims and holds above the breakdown area, do not force a short. This setup is for futures traders; spot traders can simply avoid buying until support stabilizes.
Trend structure — bullish recovery
ZEC has recovered from the marked swing low near 1,187.50 and is trading above MA(25) at 1,240.37 and MA(99) at 1,225.39. This supports a recovery bias, although it does not confirm a sustained higher-timeframe uptrend.
Resistance — 1,250 to 1,259
MA(7) is at 1,250.29, slightly above the shown price. Recent candles also approached the 24-hour high of 1,258.61 and struggled to push through. Sellers may defend this region.
Support — 1,238 to 1,242
This is near MA(25) and is a potential area for a retest. Below it, 1,233–1,234 is an additional visible chart level, followed by MA(99) near 1,225.
Volume — confirmation is needed
The chart shows a recent increase in volume during the advance, followed by lower activity in the latest bars. That may indicate momentum cooling. A new volume expansion is desirable for a breakout; declining volume alone does not prove a reversal.