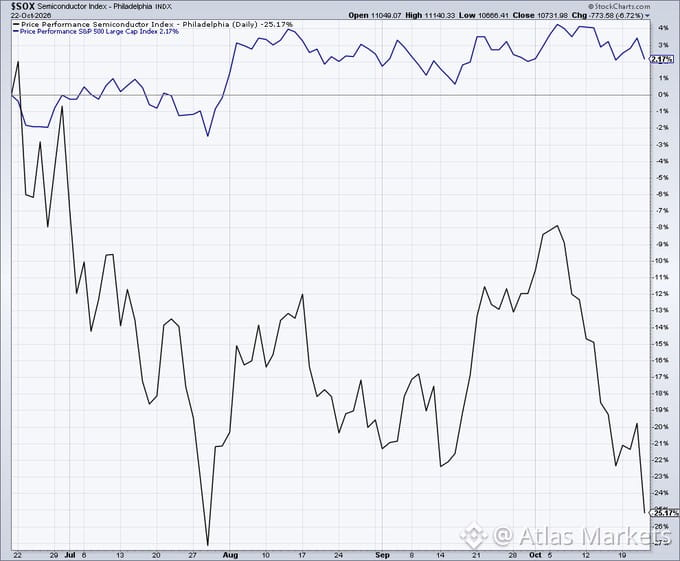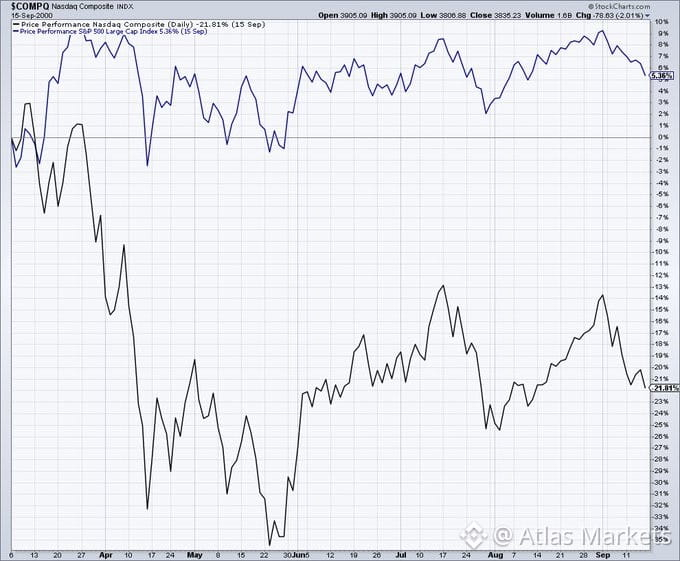
Posting two charts that tell a story about euphoria and what comes after.
First: Solana vs $SPX since June 2024. Classic parabolic blowoff into early 2025, then a violent reset. Risk-on chasing yield in crypto while the index grinds—then both get hit when liquidity tightens.
Second: Nasdaq Composite vs $SPX from March 2000 through September. Dot-com peak behavior. Tech rips, then collapses while the broader market holds up better but still bleeds. The divergence is the tell.
Same pattern, different asset class. When speculative plays decouple hard to the upside, the snap back is brutal. Solana's move mirrors that 2000 Nasdaq energy—euphoria, then distribution, then capitulation.
If you're long high-beta tech or crypto here, these comps should make you think twice about position size. History doesn't repeat, but the structure of excess and mean reversion does.