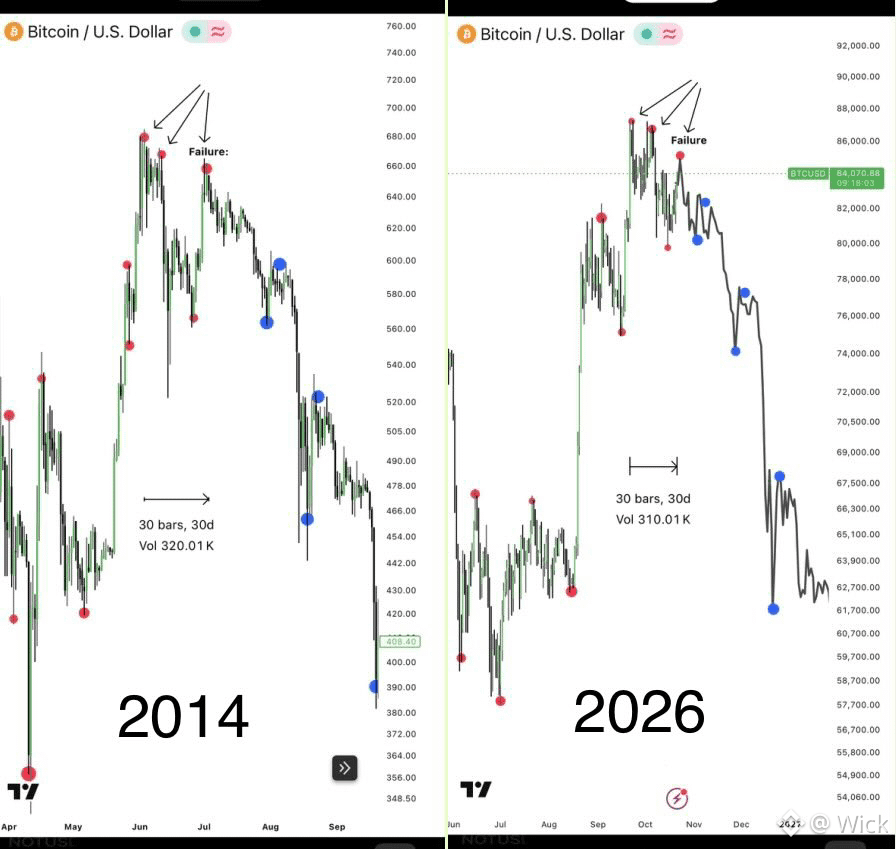
$BTC : My very First Thesis: A Prolonged Bear Market
Now compare the current structural range with the 2014 phase of Bitcoin’s 2013–2015 prolonged bear market.
Look at how closely the price action is following the same structural sequence, step by step.
The main difference is volatility. The 2013–2015 cycle featured sharper price movements, deeper wicks, and more aggressive swings. Today, institutional participation and ETFs may be contributing to lower volatility, but they haven’t necessarily changed the underlying market structure that has been repeating since Bitcoin’s earliest cycles.
The structure can repeat even when volatility changes.
As I explained in my quoted post, my additional wave analysis points to a potential failure of the final Wave C impulse ( current impulse ) followed by the beginning of a major decline toward new cycle lows.
After developing this thesis, I went back to the 2013–2015 cycle and noticed this striking structural similarity. I decided to put both charts side by side to show you what I’m seeing and why this comparison matters.
This could be a critical point in the current cycle.