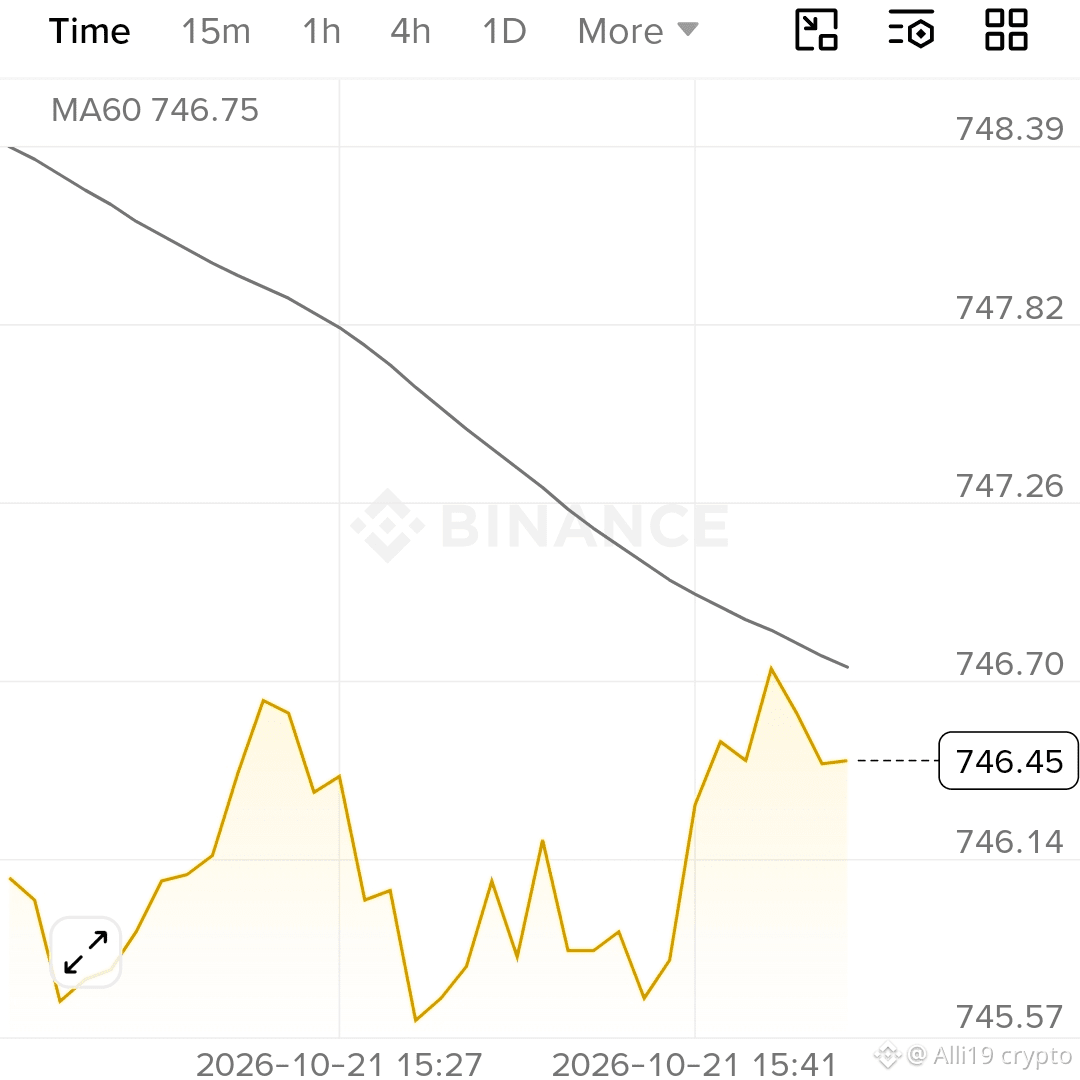
BNB Price Analysis: Binance Coin Trades at $746.45 as Bulls Attempt to Push Higher
BNB/USDT Market Update | October 21, 2026
BNB is showing signs of short-term recovery as the cryptocurrency trades around $746.45, according to the provided Binance chart. The token is up approximately 2.40% over the past 24 hours, indicating positive momentum after recent price fluctuations. However, the market is approaching a potential resistance area that traders should watch closely.
BNB Price Movement: Bulls Face Resistance Near $750
The BNB/USDT chart shows that the price has been fluctuating within a relatively narrow range during the displayed trading session. After declining toward the $745.57 area, buyers stepped in and pushed the price higher.
BNB subsequently climbed toward the $746.70 level before experiencing a slight pullback.
The 24-hour trading data in the screenshot shows:
Current price: $746.45
24-hour high: $749.99
24-hour low: $727.80
24-hour price change: +2.40%
24-hour trading volume: Approximately 73.31 million USDT
The $750 level is an important psychological price area because it sits close to the session's reported high. A sustained move above this level could attract additional buying interest, although a breakout is not guaranteed.
Moving Average Signals Potential Short-Term Pressure
One notable feature of the chart is the 60-period moving average (MA60), which stands at approximately $746.75.
BNB is trading slightly below this indicator at $746.45. This suggests that the price has not yet established a clear position above the moving average.
If buyers push BNB above $746.75 and maintain that level, short-term momentum could improve. On the other hand, repeated failures to break above the moving average may indicate that selling pressure remains present.
Traders should remember that a moving average is a lagging indicator and should not be used alone
Key Support and Resistance Levels to Watch
Based on the visible price levels in the screenshot, traders may monitor the following areas:
Potential resistance