

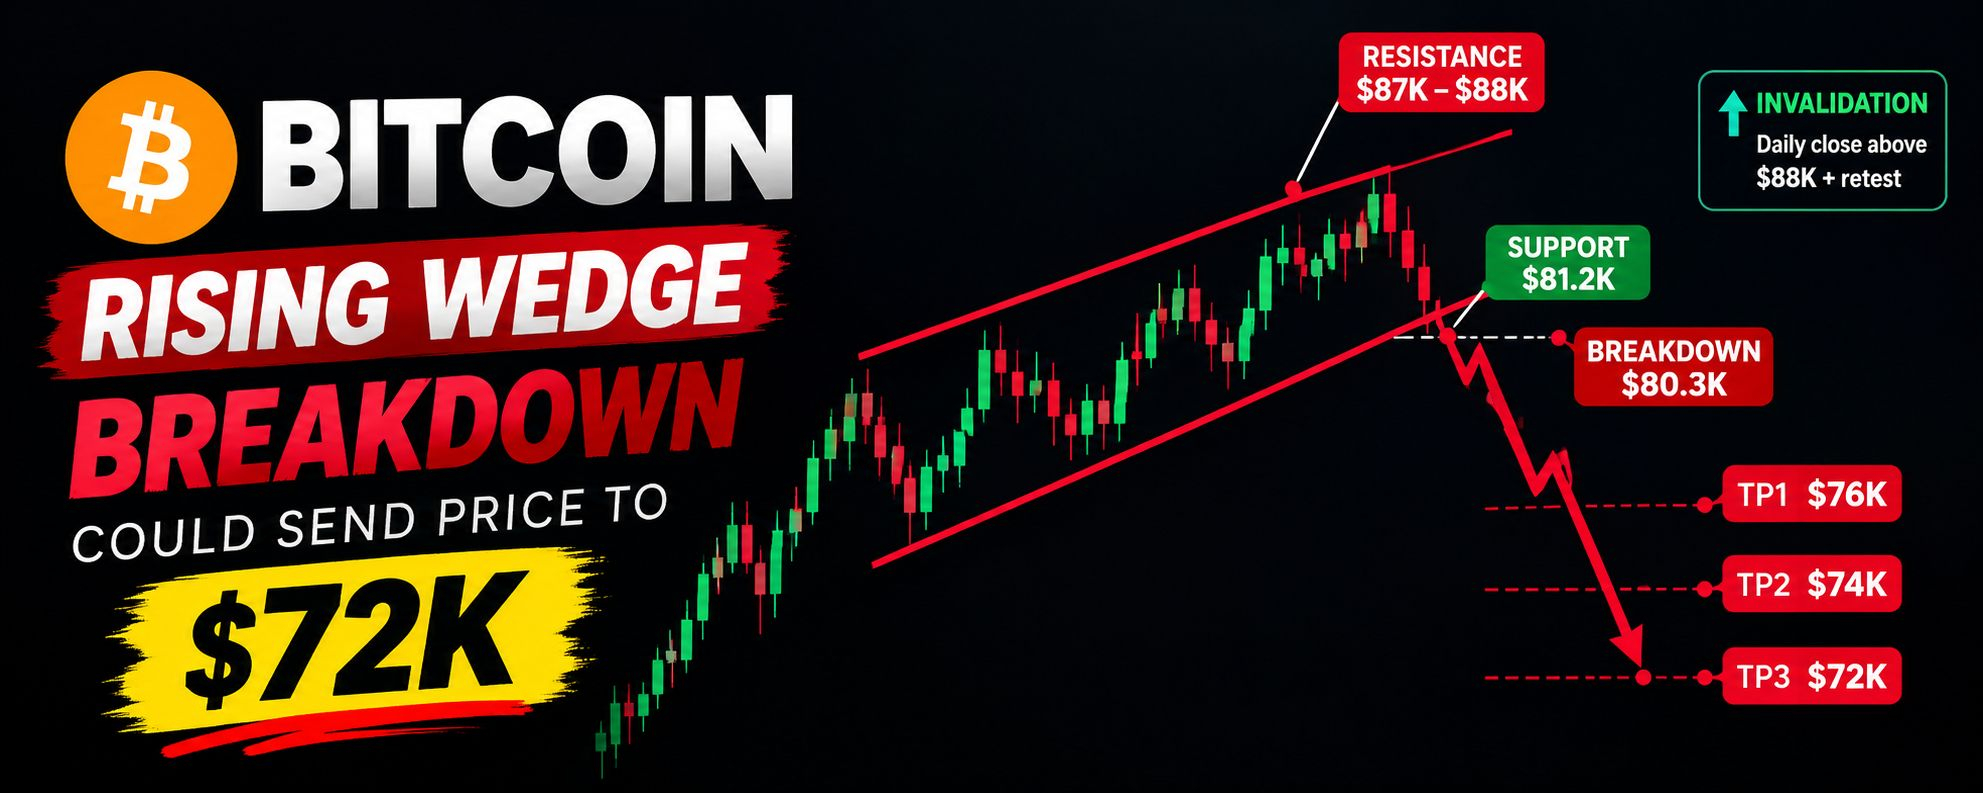

I've been sharing this $BTC chart for several days, and Bitcoin has now faced rejection near $84,300, just as expected. The next immediate support is around $81,200.
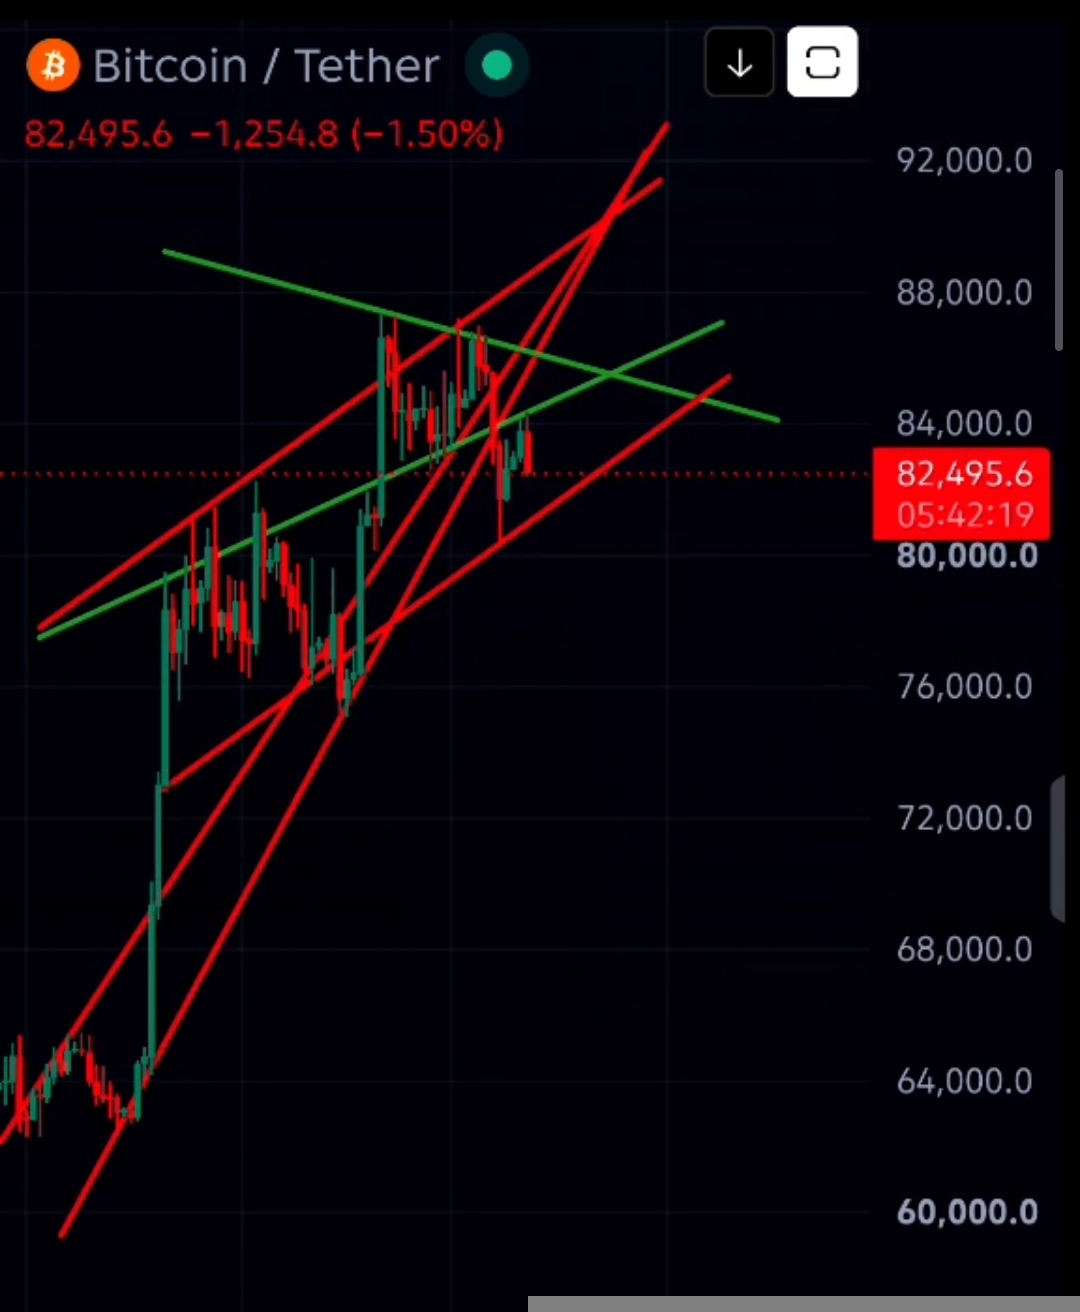
Looking at the daily timeframe, BTC is forming a bearish rising wedge, with another smaller rising wedge developing inside it. Patterns within patterns are normal, so there’s no need to panic.
🔻 Key Breakdown Level: $80,300–$80,400
This is the previous swing low and a critical level to watch. A confirmed breakdown followed by a daily close below this zone could activate the rising wedge pattern, with a potential target near $76,000–$76,500.
🎯 What Could Happen at $76K?
If Bitcoin reaches this zone, it could complete a potential Head and Shoulders pattern. The left shoulder and head would already be in place, leaving the right shoulder to develop.
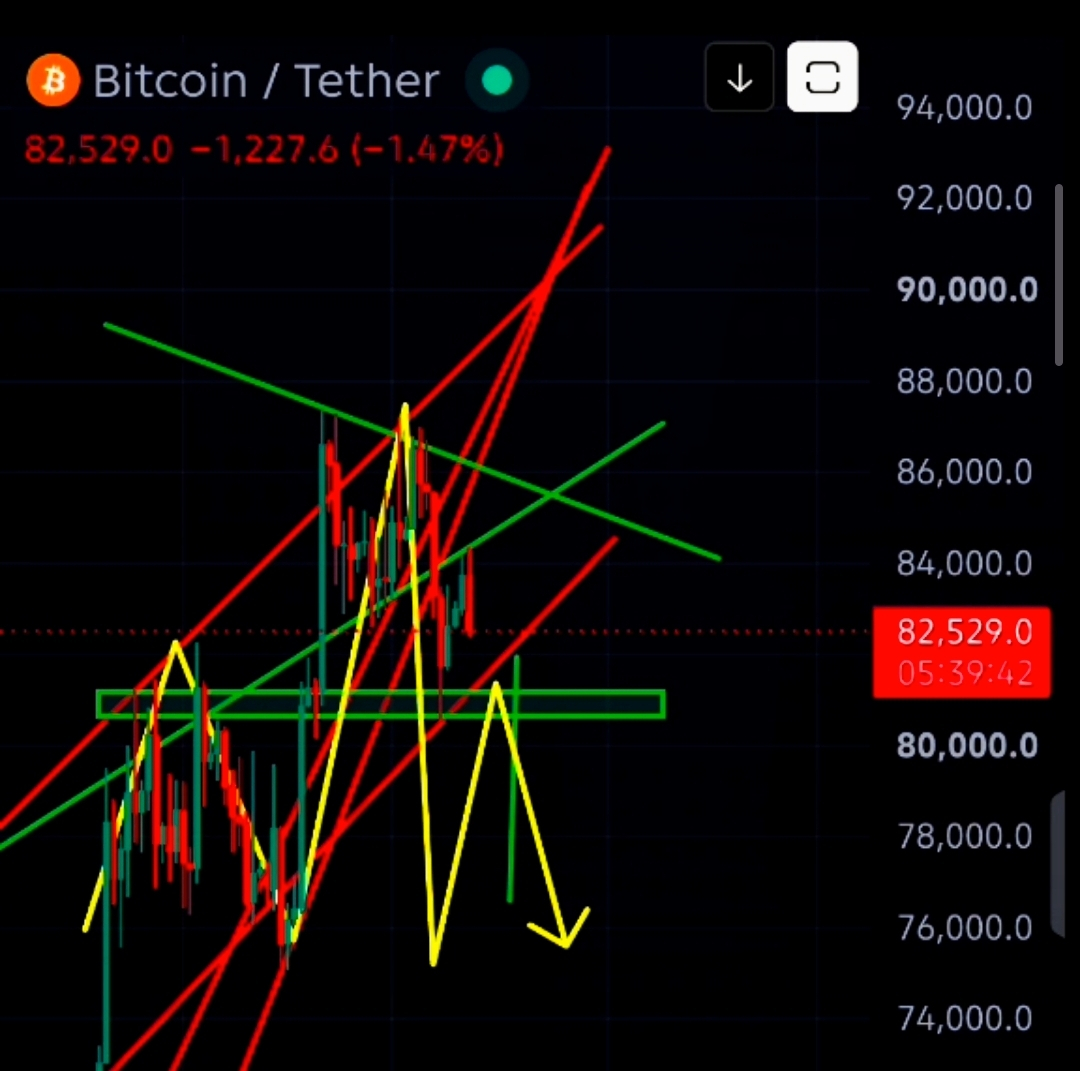
From there, BTC could bounce toward $80,000–$81,000 before facing another potential rejection. If the Head and Shoulders pattern confirms, further downside could follow.
⚠️ Invalidation Levels
• A breakout above the previous swing high at $87,400–$87,500 would weaken this bearish outlook.
• A daily close above $89,800–$89,900, or two consecutive 4H closes above this zone, would invalidate the rising wedge setup and strengthen the bullish case.
My Plan: I’m watching $81,200 for immediate support and $80,300 for the key breakdown confirmation. Until BTC breaks below $80,300, the downside target remains a scenario, not a confirmed move.
No blind entries.
Wait for confirmation and manage risk properly.
