




Bitcoin is recovering, but buyers still have an important level to clear before this bounce can develop into a stronger upside move.
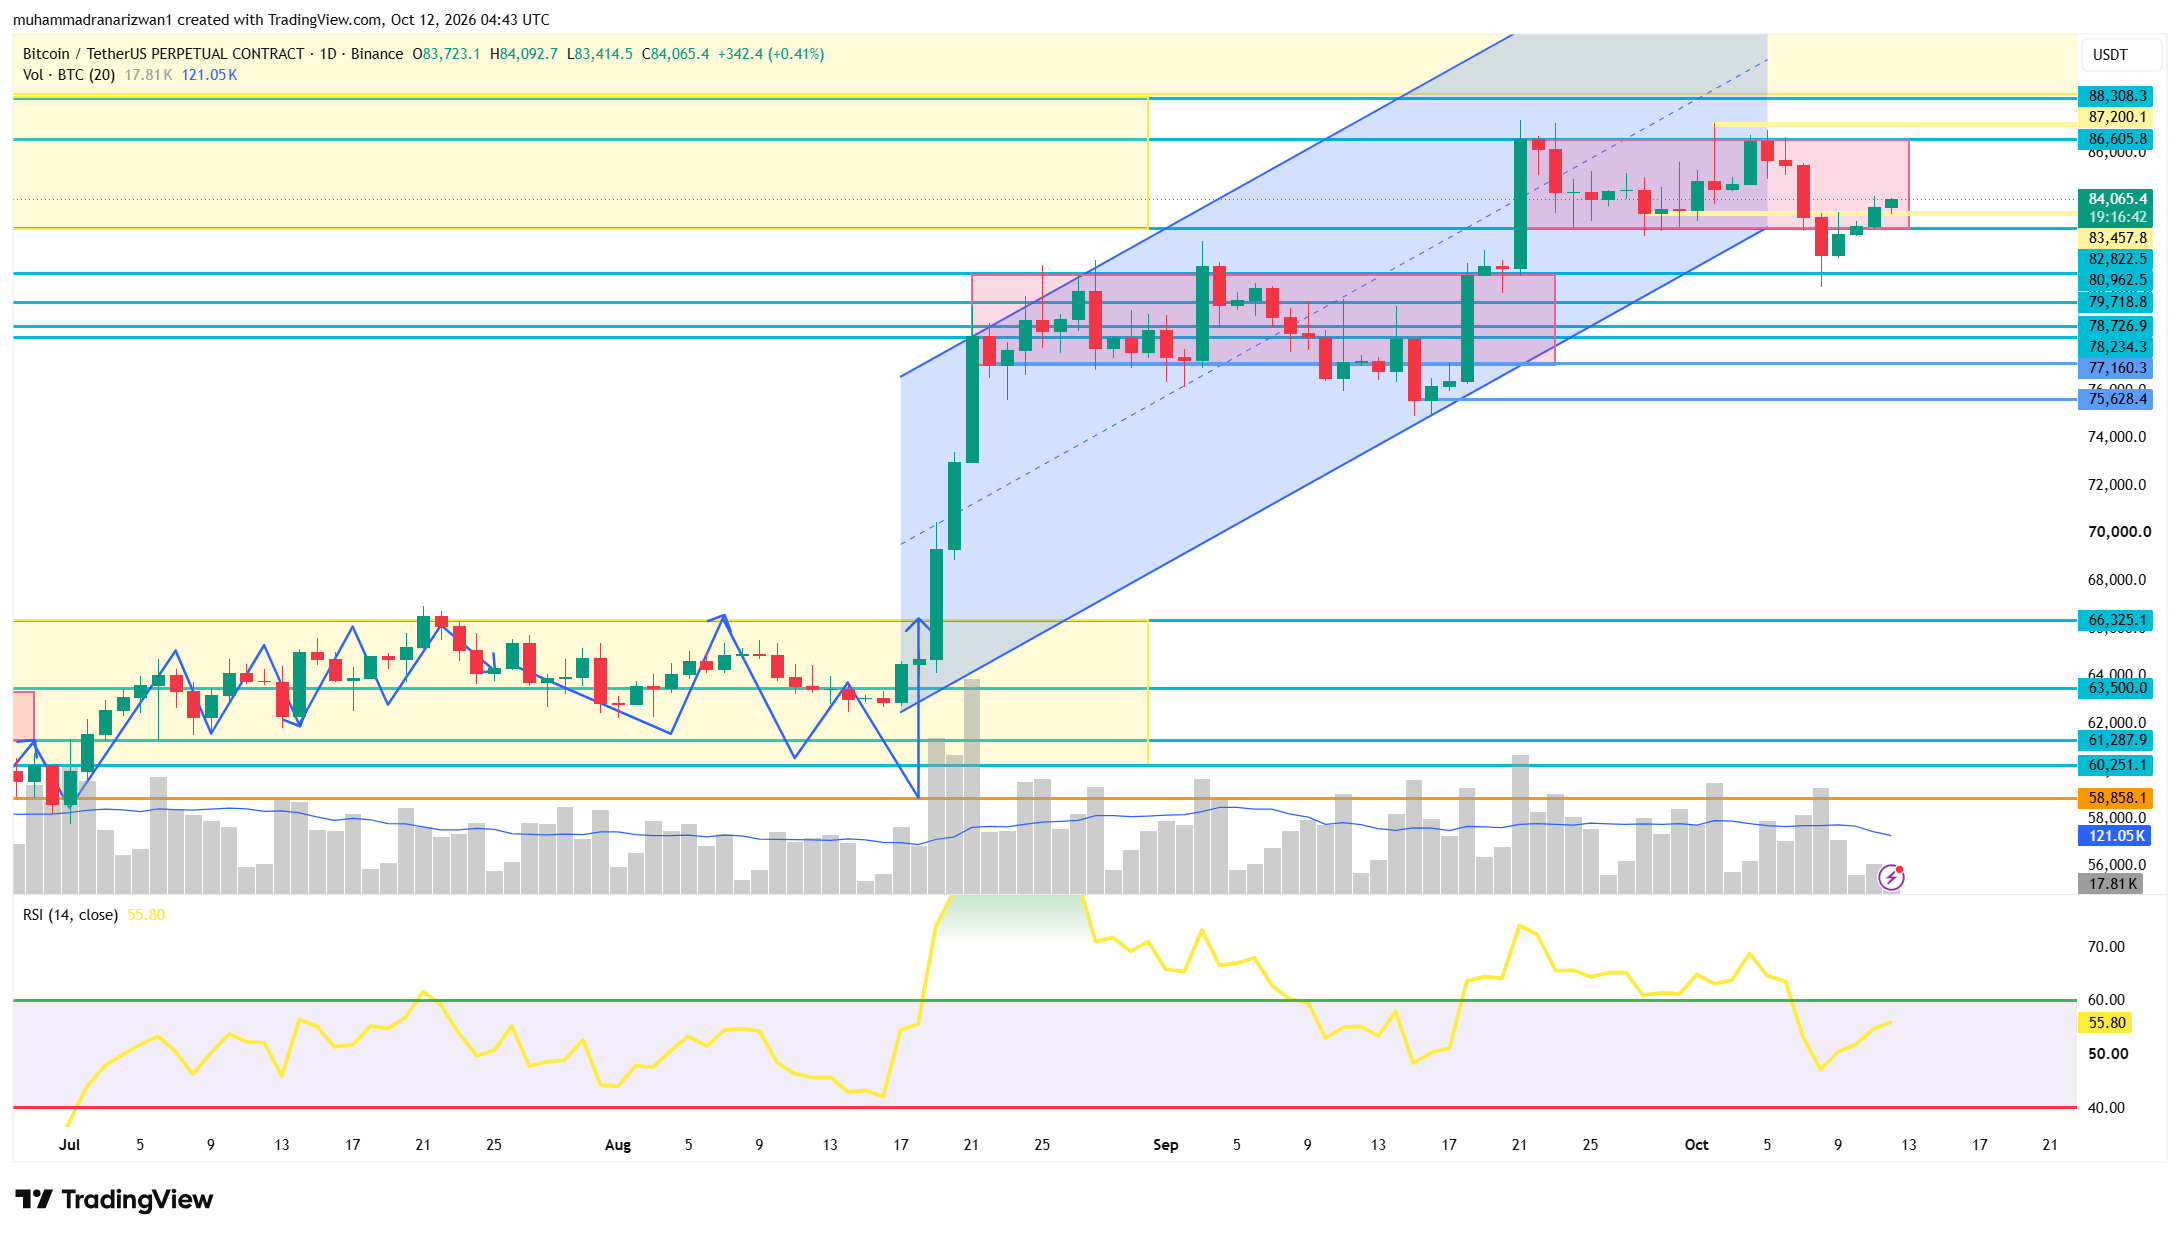
Based on the October 12 chart captured at approximately 9:43 AM Pakistan time, BTCUSDT perpetual futures were trading near $84,065, with daily RSI around 55.80.
My near-term outlook is cautiously bullish while BTC holds the $83,458–$82,823 support area. The first upside test is around $84,677–$84,706. However, a recovery into resistance does not automatically confirm a full trend reversal.
These levels refer to the supplied market snapshot, rather than a continuously updated live price.
What is the daily chart telling us?
Bitcoin recently pulled back from the $86,600 region, briefly traded below $82,823, and then recovered above that level. Price has also moved back above $83,458, giving buyers an opportunity to rebuild momentum.
There is still a reason to remain selective: price appears to have slipped beneath the lower boundary of the previously drawn ascending channel. Recovering horizontal support is constructive, but reclaiming the channel and breaking resistance would provide stronger confirmation.
For now, I view this as a recovery attempt within the recent trading range.
Momentum is improving, but confirmation matters
Daily RSI has rebounded above 50 to approximately 55.80. My interpretation is that momentum has improved from the recent pullback, although this is not an exceptionally strong bullish reading.
The accompanying dashboard also records BTC perpetual RSI near 58 on the 4-hour timeframe and 62 on the 1-hour timeframe. Those earlier readings suggest improving shorter-term momentum.
RSI should support the price structure assessment, rather than serve as a standalone entry signal.
The current daily candle is still open. Its price, RSI and volume can change substantially before the close, so the unfinished candle should not be treated as confirmed breakout evidence.
The liquidity levels that matter
The supplied dashboard identifies two nearby areas to monitor:
• Upper liquidity: approximately $84,677–$84,706
• Lower liquidity: approximately $82,195–$82,236
These are potential reaction areas, not guaranteed destinations. Liquidity estimates can also change as positions are opened and closed.
If BTC reaches the upper zone, the key question is whether buyers can hold above it. A brief wick followed by a return below resistance would carry a different message from a sustained breakout and successful retest.
Key levels on my chart
• $84,677–$84,706: Immediate upside test.
• $86,606: Major resistance within the recent range.
• $87,200: Next overhead resistance.
• $88,308: Higher resistance if the recovery extends.
• $83,458: First important support.
• $82,823: Lower support and a key breakdown threshold.
• $82,195–$82,236: Dashboard’s lower liquidity area.
• $80,963: Next major chart support.
• $79,719: Deeper downside support.
The higher targets would require follow-through and could take more than one session to reach.
My preferred bullish scenario
If BTC continues holding above $83,458, I would watch for a move toward $84,700.
A confirmed break above that zone, followed by a retest that holds, would strengthen the case for a recovery toward $86,606. Beyond that, $87,200 and $88,308 become relevant.
However, buying directly into $84,700 before confirmation leaves the trade exposed to rejection at the first resistance.
Conditional trade signal: Breakout long
• Trigger: A 1-hour candle closes above $84,750, followed by a successful retest.
• Planned entry zone: $84,650–$84,800, only after the retest shows support.
• Stop-loss: $84,150.
• Take-profit 1: $85,500 — an intermediate profit-taking level.
• Take-profit 2: $86,600.
• Take-profit 3: $87,200.
Using an example entry of $84,700, the risk is $550 per BTC. The approximate reward-to-risk ratios are 1.45R, 3.45R and 4.55R, before fees and slippage.
This setup is not active simply because price touches the entry zone. Without the breakout and successful retest, there is no confirmed long entry.
What would weaken the recovery?
A move back below $83,458 would be an early warning that buyers are losing control.
A confirmed breakdown below $82,823 would weaken the bullish scenario more clearly and bring the lower liquidity area near $82,236 into focus. Continued selling could then expose $80,963.
Conditional trade signal: Breakdown short
• Trigger: A 1-hour candle closes below $82,800, followed by a failed attempt to reclaim $82,823.
• Planned entry zone: $82,700–$82,850, after rejection is confirmed.
• Stop-loss: $83,300.
• Take-profit 1: $82,250.
• Take-profit 2: $80,963.
• Take-profit 3: $79,719.
Using an example entry of $82,800, risk is $500 per BTC. The approximate reward-to-risk ratios are 1.10R, 3.67R and 6.16R, before fees and slippage.
The first target is close, so the setup depends on sufficient room for continuation. Avoid chasing a sharp drop after price has already reached the first target.
How I would manage these setups
These are alternative scenarios, not instructions to open both trades. I would wait for the market to activate one clearly.
Keep risk small—for example, 0.5% of account equity on a single idea—and calculate position size from the stop-loss distance. Leverage does not reduce the underlying risk. Never widen the stop to keep a losing position open.
My working bias remains a recovery toward $84.7K while support holds. Acceptance above that level would improve the outlook toward $86.6K. Losing $82.8K would shift my attention back toward downside continuation.
Are you watching a confirmed breakout above $84.7K, or waiting for another support test?
Educational market commentary only. These are conditional trade plans, not guaranteed outcomes.
#Bitcoi #btc70k #BTCUSDTAnalysis #CryptoTradingInsights #BitcoinAnalysis2026 $BNB