

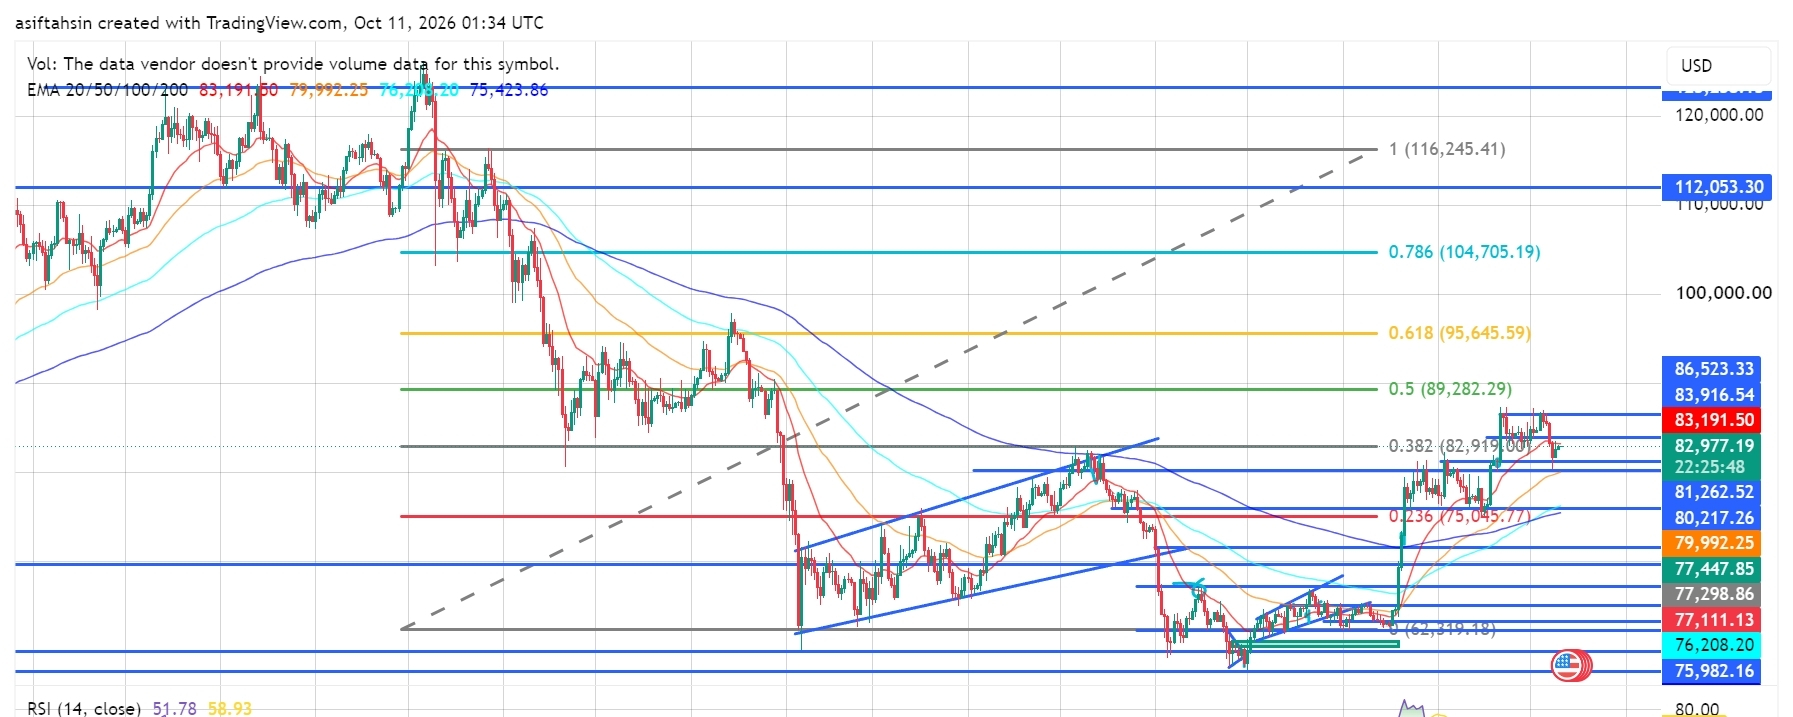

Bitcoin is currently trading around $82,977–$83,190, consolidating after its recent recovery from the $71,500–$75,000 region. BTC has reclaimed several important support levels, but price is now facing resistance around $82,919–$83,916.
The broader recovery structure remains constructive, although momentum has cooled after the recent push higher. A sustained breakout above the nearby resistance zone would strengthen the bullish outlook, while losing the $81,000–$80,200 support area could trigger a deeper pullback.
📊 EMA Structure
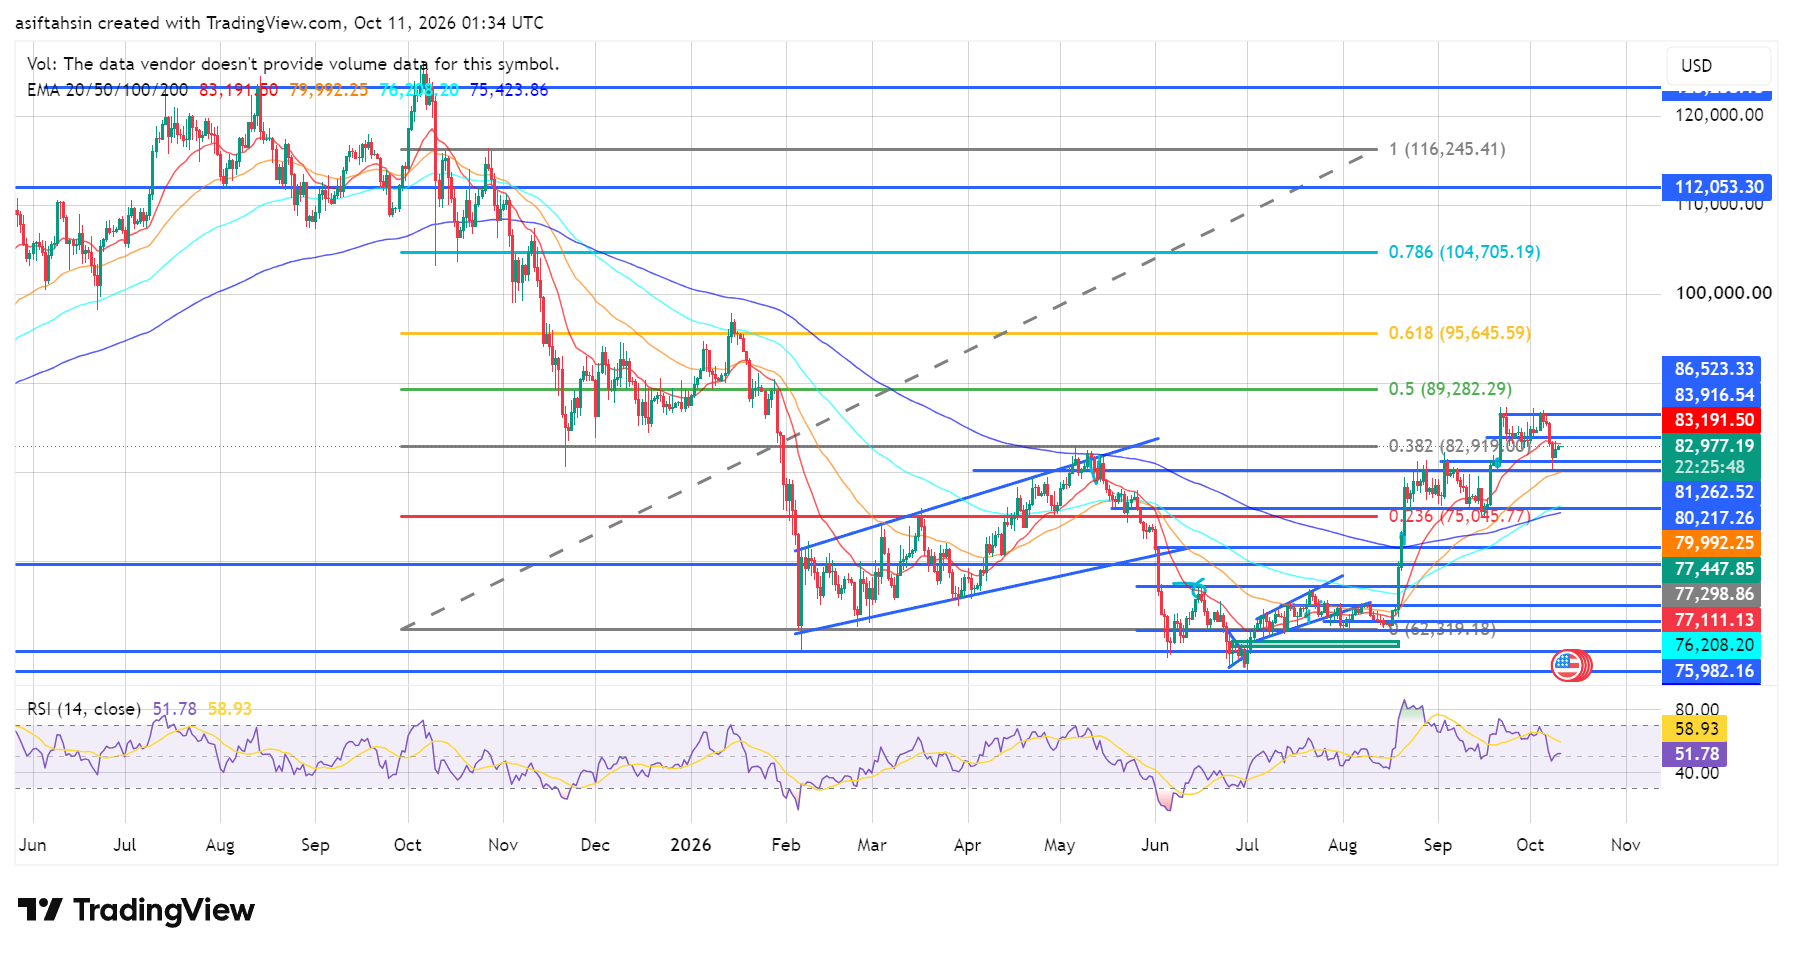
* 20 EMA: $83,190
* 50 EMA: $79,992
* 100 EMA: $76,208
* 200 EMA: $75,424
BTC is trading around the 20 EMA and remains above the 50, 100, and 200 EMAs. This supports the broader recovery, but the 20 EMA is now an important short-term pivot.
A sustained move above the 20 EMA would help restore immediate bullish momentum. Losing it could expose the lower support zones.
📐 Fibonacci Levels
Based on your chart:
* 0.236: $75,045.77
* 0.382: $82,919
* 0.5: $89,282.29
* 0.618: $95,645.59
* 0.786: $104,705.19
* 1.0: $116,245.41
The immediate challenge is holding above the 0.382 Fibonacci region near $82,919. The next major Fibonacci resistance sits at $89,282.
🚀 Bullish Scenario
If BTC holds above $82,000–$82,900 and reclaims the recent local highs, buyers could attempt another push toward:
🎯 $83,916 🎯 $86,523 🎯 $89,282 🎯 $95,645 🎯 $104,705
A decisive breakout above $86,523 would improve the bullish outlook, while $89,282 is the next major Fibonacci resistance.
🔄 Pullback Scenario
If BTC fails to hold the $82,919 area, watch these support zones:
* $82,000–$81,262
* $80,217
* $79,992 — 50 EMA
* $77,448–$77,111
* $76,208 — 100 EMA
* $75,424 — 200 EMA
* $71,543
A pullback toward $81,262–$80,217 could be a normal retest. However, losing $80,217 would weaken the recovery and expose the lower support cluster around $77,000–$75,400.
📊 RSI Momentum
RSI: 51.78
RSI is near the neutral 50 level, suggesting that bullish momentum has cooled after the recent rally.
A move back above 60 would strengthen the case for continuation. A drop below 45 would signal increasing downside momentum.
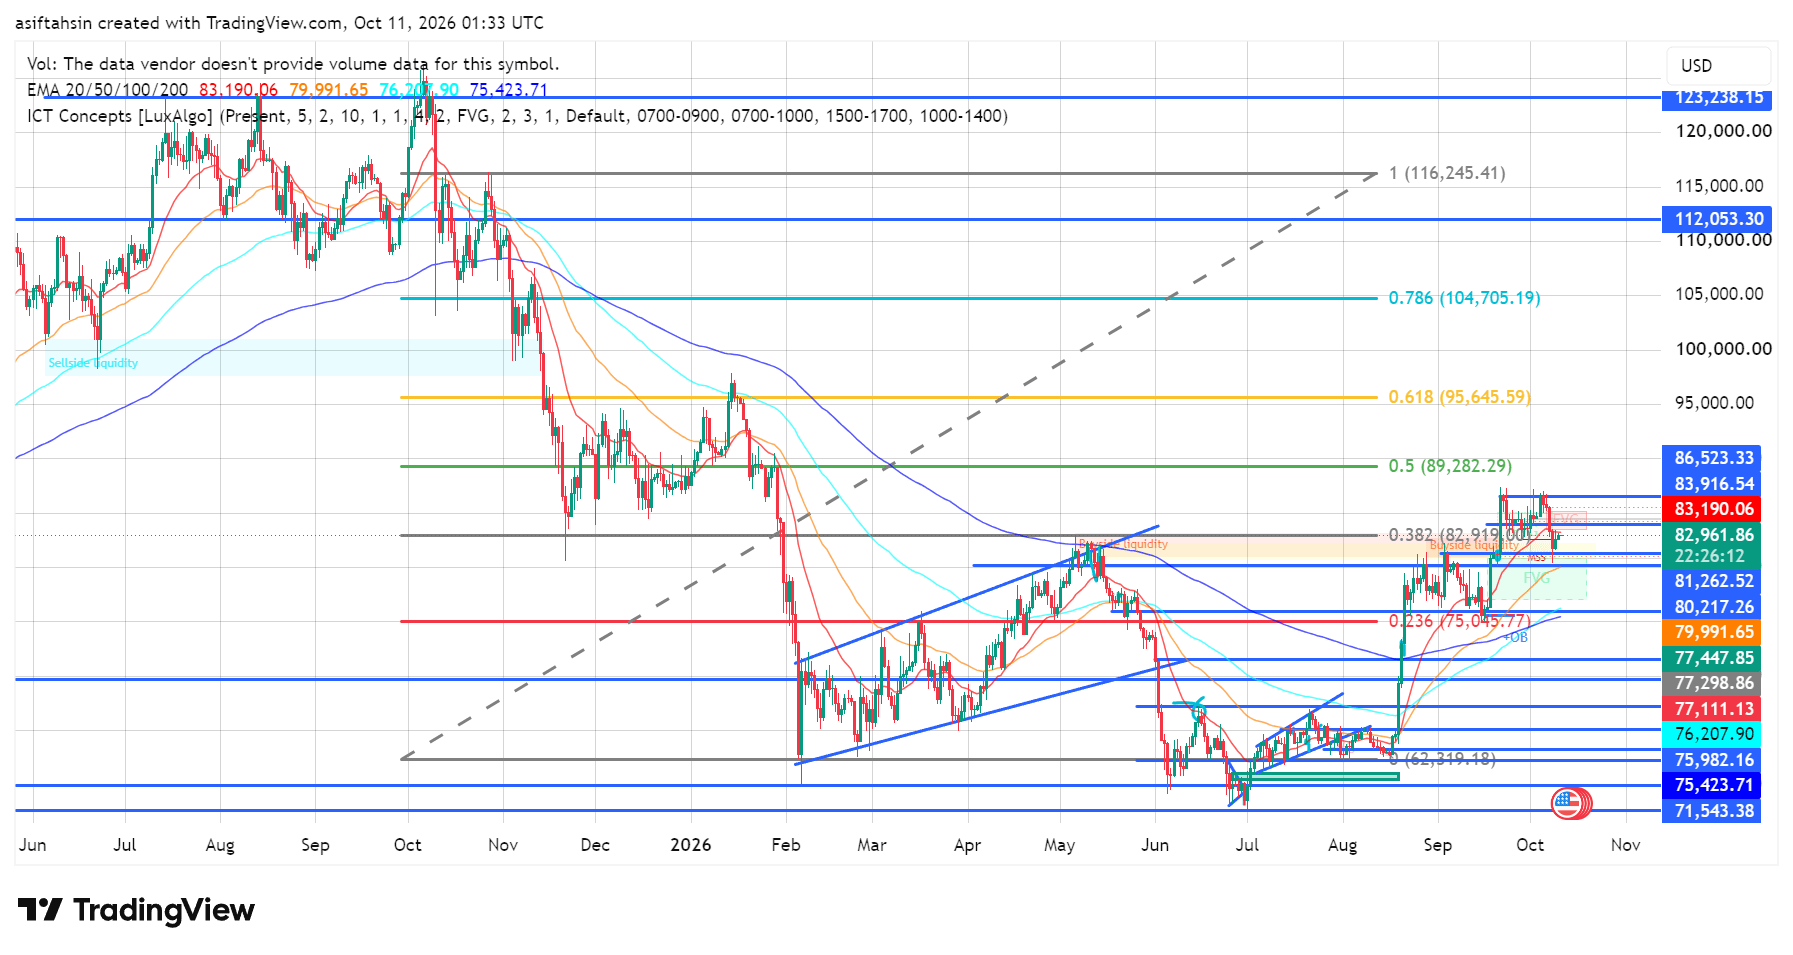
📈 Market Structure & Liquidity
BTC has recovered strongly from the $71,543 region, reclaimed several resistance levels, and pushed back toward $84,000.
Price is now consolidating around the $82,900–$83,900 zone, where buyers need to demonstrate enough strength to continue higher.
The structure remains constructive while BTC holds above the $80,200 area, but a confirmed breakout is still needed to establish stronger continuation.
🔑 Key Levels
Resistance
* 🔴 $83,916
* 🔴 $86,523
* 🔴 $89,282
* 🔴 $95,645
* 🔴 $104,705
Support
* 🟢 $82,919
* 🟢 $81,262
* 🟢 $80,217
* 🟢 $79,992
* 🟢 $77,448–$77,111
* 🟢 $75,424
🎯 Final Outlook
BTC remains neutral-to-bullish while holding above $80,217, but short-term momentum is not yet strong enough to confirm another major breakout.
A sustained move above $83,916–$86,523 could open the path toward $89,282, followed by $95,645.
On the downside, a break below $80,217 would increase the risk of a deeper correction toward $77,000–$75,400.
Bias: 🟡 Neutral-to-bullish above $80,217 | Breakout above $86,523 → $89,282 → $95,645
