

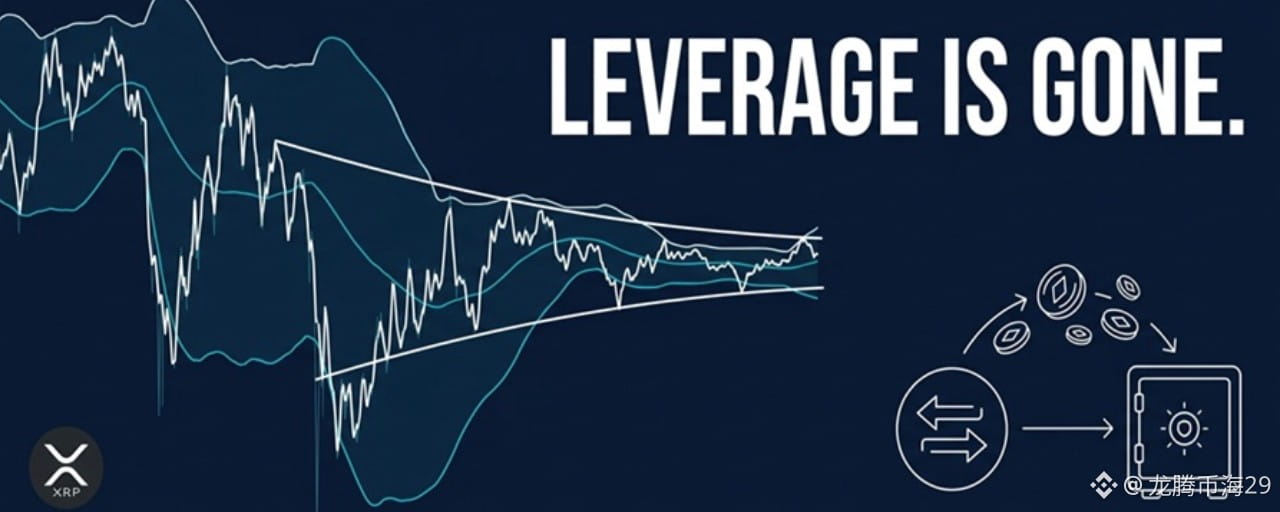

XRP has become a coin that refuses to move, and that is precisely what makes it interesting right now.
Price is stuck near $1.40, roughly 62% below its record high of $3.65 from July 2025. Weekly Bollinger Bands have compressed to levels last seen during previous multi-year accumulation phases. Open interest on Binance has fallen 15.3% from its six-month peak. And yet, large holders are pulling tokens off exchanges at a pace not seen in seven months.
These three data points tell different stories. Together, they describe a market that has quietly removed its speculative excess while longer-term holders appear to be repositioning. Whether that leads to a breakout or another leg down is not knowable. But the setup deserves a closer look.
The Binance Withdrawal Story
According to CryptoQuant data, the 30-day sum of XRP outflows from Binance has reached approximately 1.38 billion tokens, the highest reading in seven months. Transfers involving at least one million XRP represented 60.8% of Binance's outflow value on September 30, meaning this was not retail panic selling but deliberate movement by large addresses.
There is an important qualification here. Exchange outflows count withdrawals, not net flows. Coins leaving Binance could be moving to cold storage, to other exchanges, or settling over-the-counter trades. CryptoQuant separately reported that XRP whale inflows to Binance totaled about 1.6 billion tokens over the prior 30 days, with exchange reserves standing near 2.62 billion XRP, actually the highest level in roughly 69 days. Large holders have been both depositing and withdrawing at elevated rates.
What makes the picture more nuanced is a separate data point. The Whale vs Retail Spread across all centralized exchanges fell from 64% to 46.7% between September 30 and October 8, a 17.3 percentage point decline in just eight days. Whale dominance in exchange outflows is narrowing. This does not confirm whale selling. It does suggest that the composition of who is moving coins is shifting, and that simple accumulation narratives may be incomplete.
Leverage Is Draining, and That Matters
While exchange flows generate headlines, the derivatives market has been quietly resetting.
Binance XRP open interest fell to $521.5 million, down 15.3% from its six-month high of $616.1 million on September 22. The estimated leverage ratio dropped from 0.230 to 0.197, though it remains above the six-month average of 0.169. Funding rates eased from 0.010 to 0.005. Long liquidations on Binance averaged $3.72 million per day from September 24 through September 29, about 2.6 times the six-month daily average.
This matters because leverage falling faster than price is a different dynamic than leverage falling alongside price. The former suggests traders reducing risk proactively. The latter suggests forced selling. XRP trades roughly 5% below its six-month high of $1.572, while open interest has dropped 15.3%. The ratio implies an orderly unwind rather than a cascade.
Whale holdings tell a similar story of patience. Analyst Ali Martinez noted that XRP whale holdings have remained largely unchanged over the past week at around 3.90 billion XRP, pointing to a lack of significant accumulation or distribution among large holders. Nobody is making aggressive bets in either direction.
The Technical Picture: Compression Without Conviction
On the daily chart, XRP is trading around $1.40 after a correction from September highs. Buyers defended the $1.30 support zone, but the rebound has been modest. The $1.45 area, where a descending trendline from the September highs converges, is the immediate hurdle. A convincing break above that level could target the $1.60 to $1.70 zone. Failure to clear it keeps the bearish structure intact.
Below, the $1.30 zone carries additional weight because the 100-day and 200-day moving averages are converging near that level. The 200-day EMA sits at $1.28, a structural floor that has held on a daily closing basis.
Momentum is absent. The daily RSI is at 44, below its 50 midpoint but not in oversold territory. This reading describes a market without directional conviction. It is not a signal to buy or sell. It is a signal that neither side has control.
The Bollinger Band setup adds an important dimension. The lower band sits at $1.39, the midline at $1.49, and the upper band at $1.59, placing price near the lower edge of the range. Tightening bands typically precede volatility expansion, though the direction is not predetermined.
Meanwhile, ETF demand has diverged from price action. U.S. spot XRP ETFs attracted approximately $1.7 billion in cumulative inflows by mid-September. In late August, they recorded their strongest week of 2026 with $110.49 million of inflows, while XRP itself was falling. Regulated institutional demand has not been sufficient to dictate short-term price direction.
What Would Need to Change
The technical evidence does not currently support a directional conclusion. What it does support is a set of observable conditions that would clarify the picture.
A sustained close above $1.45 with expanding volume would suggest buyers are willing to absorb supply at higher prices. Clearing the $1.52 to $1.53 zone would confirm that the descending trendline has been broken and shift the structural bias upward. The $1.66 to $1.70 area is the next significant resistance, but it should be treated as a potential supply zone rather than a guaranteed target.
On the downside, a daily close below $1.30 would place the demand zone under pressure and expose the 200-day EMA at $1.28. Losing that level could bring the $1.15 to $1.10 area into view. A breakdown below $0.98 would represent a structural failure of the longer-term accumulation pattern.
The derivatives market could also shift the setup. With open interest at restrained levels and whale holdings unchanged, there is relatively little leverage in the system to fuel a squeeze in either direction. A sudden increase in open interest alongside a price move above $1.45 would signal new positioning. A rise in open interest alongside a breakdown below $1.30 would signal the opposite.
The Catalyst Question
Ripple's Swell 2026 event, scheduled for New York with approximately 1,500 participants, has placed “the first year of a spot XRP ETF” among its core institutional topics. The SEC declared a post-effective amendment for the Bitwise XRP ETF effective on September 28, indicating continued product evolution rather than stagnation.
These are ecosystem developments, not direct price catalysts. They expand the institutional infrastructure around XRP without guaranteeing token demand. Traders who treat conference agendas as bullish signals may be disappointed. The more relevant question is whether ETF inflows translate into spot buying pressure, and the evidence so far suggests the relationship is weak.
Practical Takeaway
XRP is in a holding pattern where the data points in multiple directions. Whale withdrawal figures look constructive on the surface but carry important caveats about net flows and the narrowing whale-retail spread. Leverage has reset in an orderly fashion, which removes a source of instability without necessarily creating an upside catalyst. Price action remains compressed, with $1.45 as the level that would begin to change the narrative and $1.30 as the floor that has held so far.
The market has not decided. Until it does, the setup offers more questions than answers, which for patient traders may be exactly the point.
This article is for informational purposes only and does not constitute financial advice. Cryptocurrency trading involves substantial risk of loss. Conduct your own research and consult a qualified financial professional before making any investment decisions. Never trade with funds you cannot afford to lose.
