


📊 GOLD (XAU/USDT) DAILY ANALYSIS | October 10, 2026
🥇 Gold Is Showing Signs of a Short-Term Recovery!
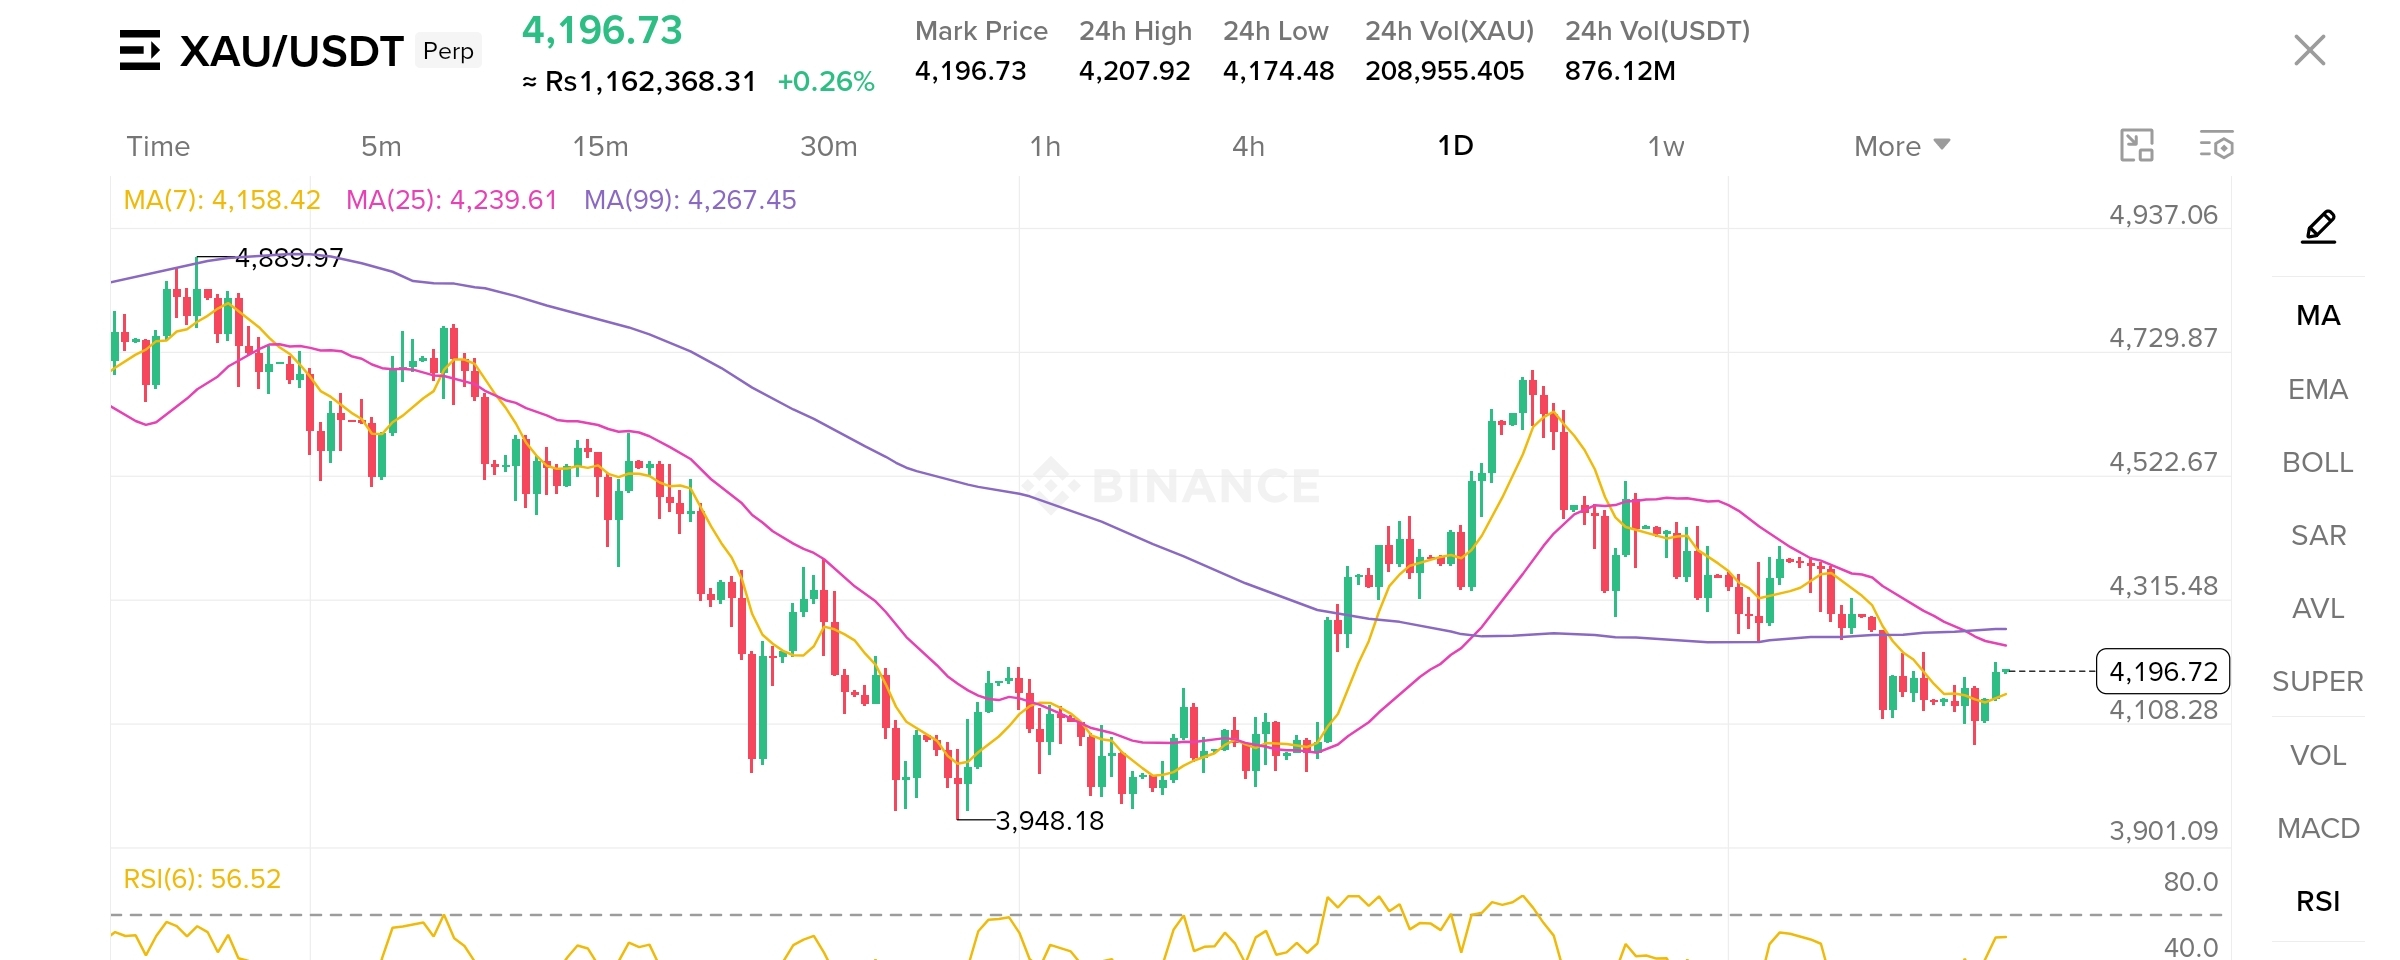
Gold is currently trading around 4,196.73 on the daily chart.
🔍 Technical Analysis:
- Current Price: 4,196.73
- MA(7): 4,158.42
- MA(25): 4,239.61
- MA(99): 4,267.45
- RSI(6): 56.52
📈 Key Resistance Zones:
- 4,239–4,267
- 4,315
- 4,400
📉 Key Support Zones:
- 4,158
- 4,108
- 3,948
🟢 Bullish Scenario: If Gold breaks and holds above 4,239–4,267, the price could move toward 4,315 and potentially higher.
🔴 Bearish Scenario: If Gold faces rejection near resistance and breaks below 4,108, further downside may follow.
💡 My View: Gold is showing a short-term recovery, but the broader trend remains uncertain while price trades below the MA(25) and MA(99). Confirmation is important before entering any trade.
⚠️ This is technical analysis for educational purposes only, not financial advice. Always manage risk and wait for confirmation.
💬 What do you think? Is Gold ready for a bullish breakout, or will sellers take control?
#BinanceSquare #Gold #XAUUSDT #TechnicalAnalysis #Trading #CryptoTrading #PriceAction