

Gold futures on Binance $XAU trade like any crypto pair: long, short, leverage. And where there is leverage, there are liquidations. A liquidation heatmap shows where they sit.
But the bands on the map only make sense once you know why they matter.
A liquidation is a forced market order
When a short gets liquidated, the exchange closes it with a market buy. When a long gets liquidated, the exchange sells at market. The trader does not choose the price.
Now look at it from a big player's side.
A fund wants to sell a large gold position. If it sells right now, it pushes the price down itself. It needs buyers, many at once. A bright band of short liquidations above the price is exactly that: a guaranteed wave of market buys. Sell into it and the size gets filled at a good price.
The mirror works too: a band of long liquidations below the price is a wave of market sells that a big buyer can absorb.
That is why these bands are called liquidity. It does not mean price will go there. It means big players have a reason to push it there.
Cascades
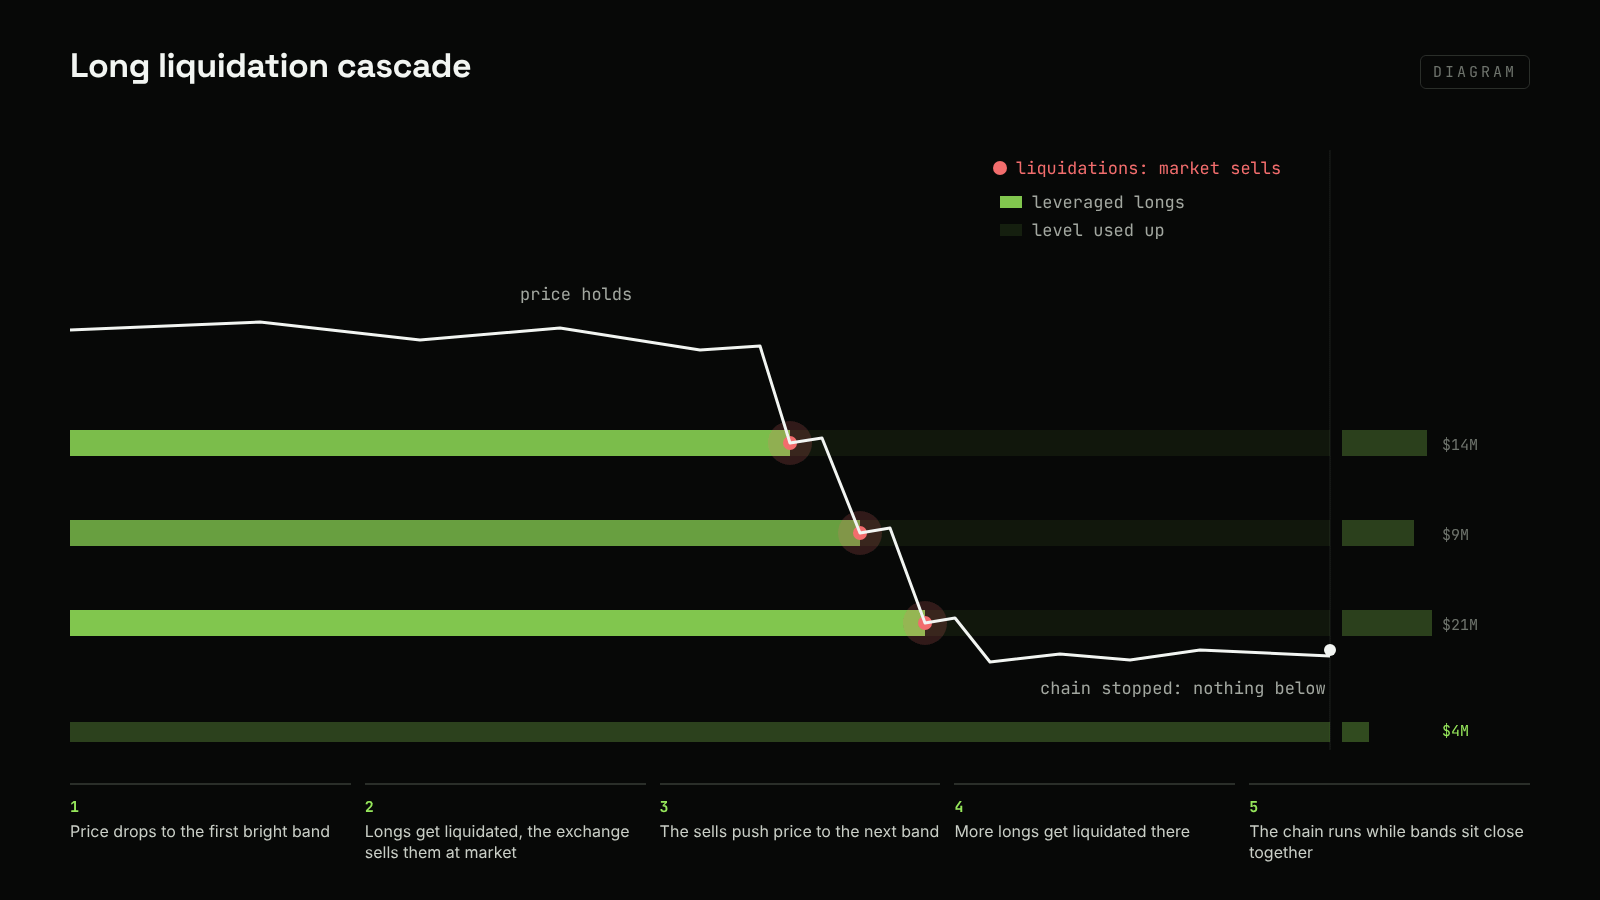
Liquidations come in chains. Price hits a band, longs get liquidated, the market sells push price to the next band, more longs get liquidated. If bright bands sit close together with no gaps, a cascade has room to run. That is how sharp candles happen without any news.
Real example, October 9
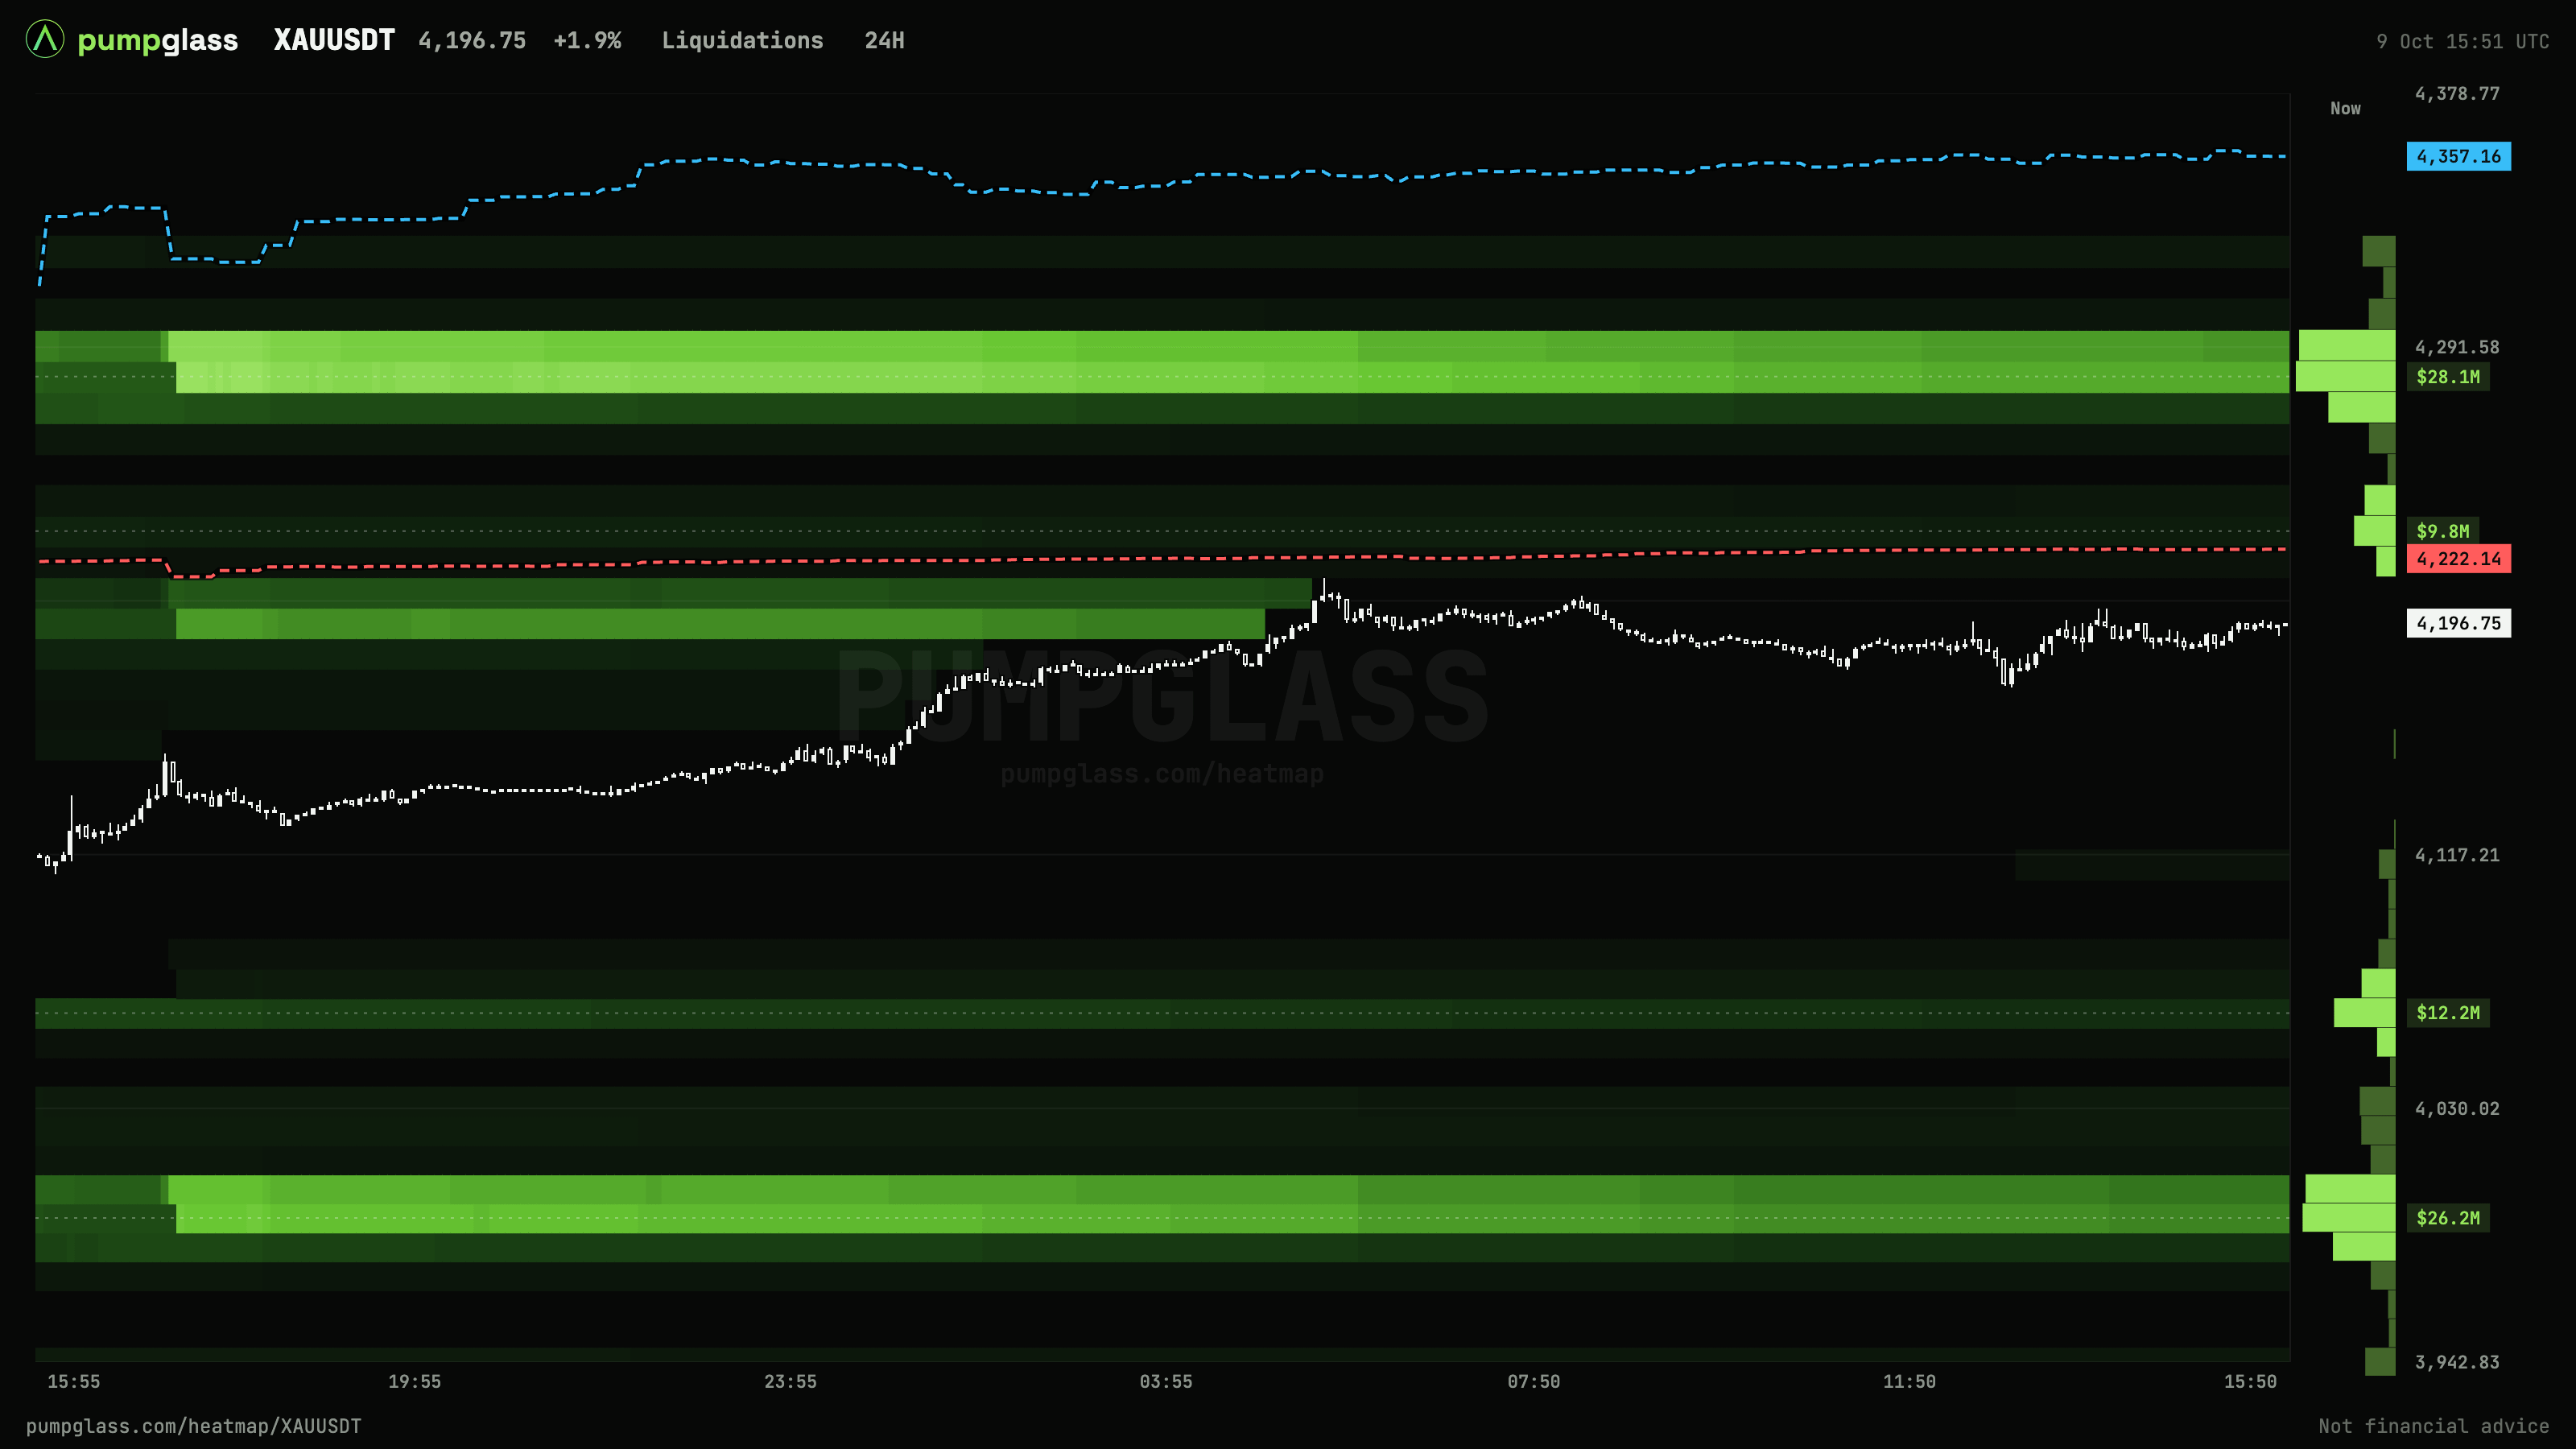
Gold at 4,196.
Above: a small $9.8M band at +0.8%, then the main $28.1M band near 4,280 (+2%).
Below: $12.2M near 4,060 (-3%) and the main $26.2M band near 3,990 (-5%).
Leverage on both sides is almost equal, but the shorts sit two and a half times closer to the price. The small band at +0.8% could be the first link of a chain toward +2%.
This is not a forecast. It shows which side would feel pressure first if a move starts.
Check your stop
If your stop sits inside a bright band, you are in the crowd that gets taken out first. Price wicks into the band, the cascade fires, and half an hour later price is back without you. Many traders place the stop beyond the band, not inside it.
Two more layers worth opening
Order book: real limit orders. A clear, long line means a large order has been sitting there for hours. If it disappears as price comes close, it was there for show.
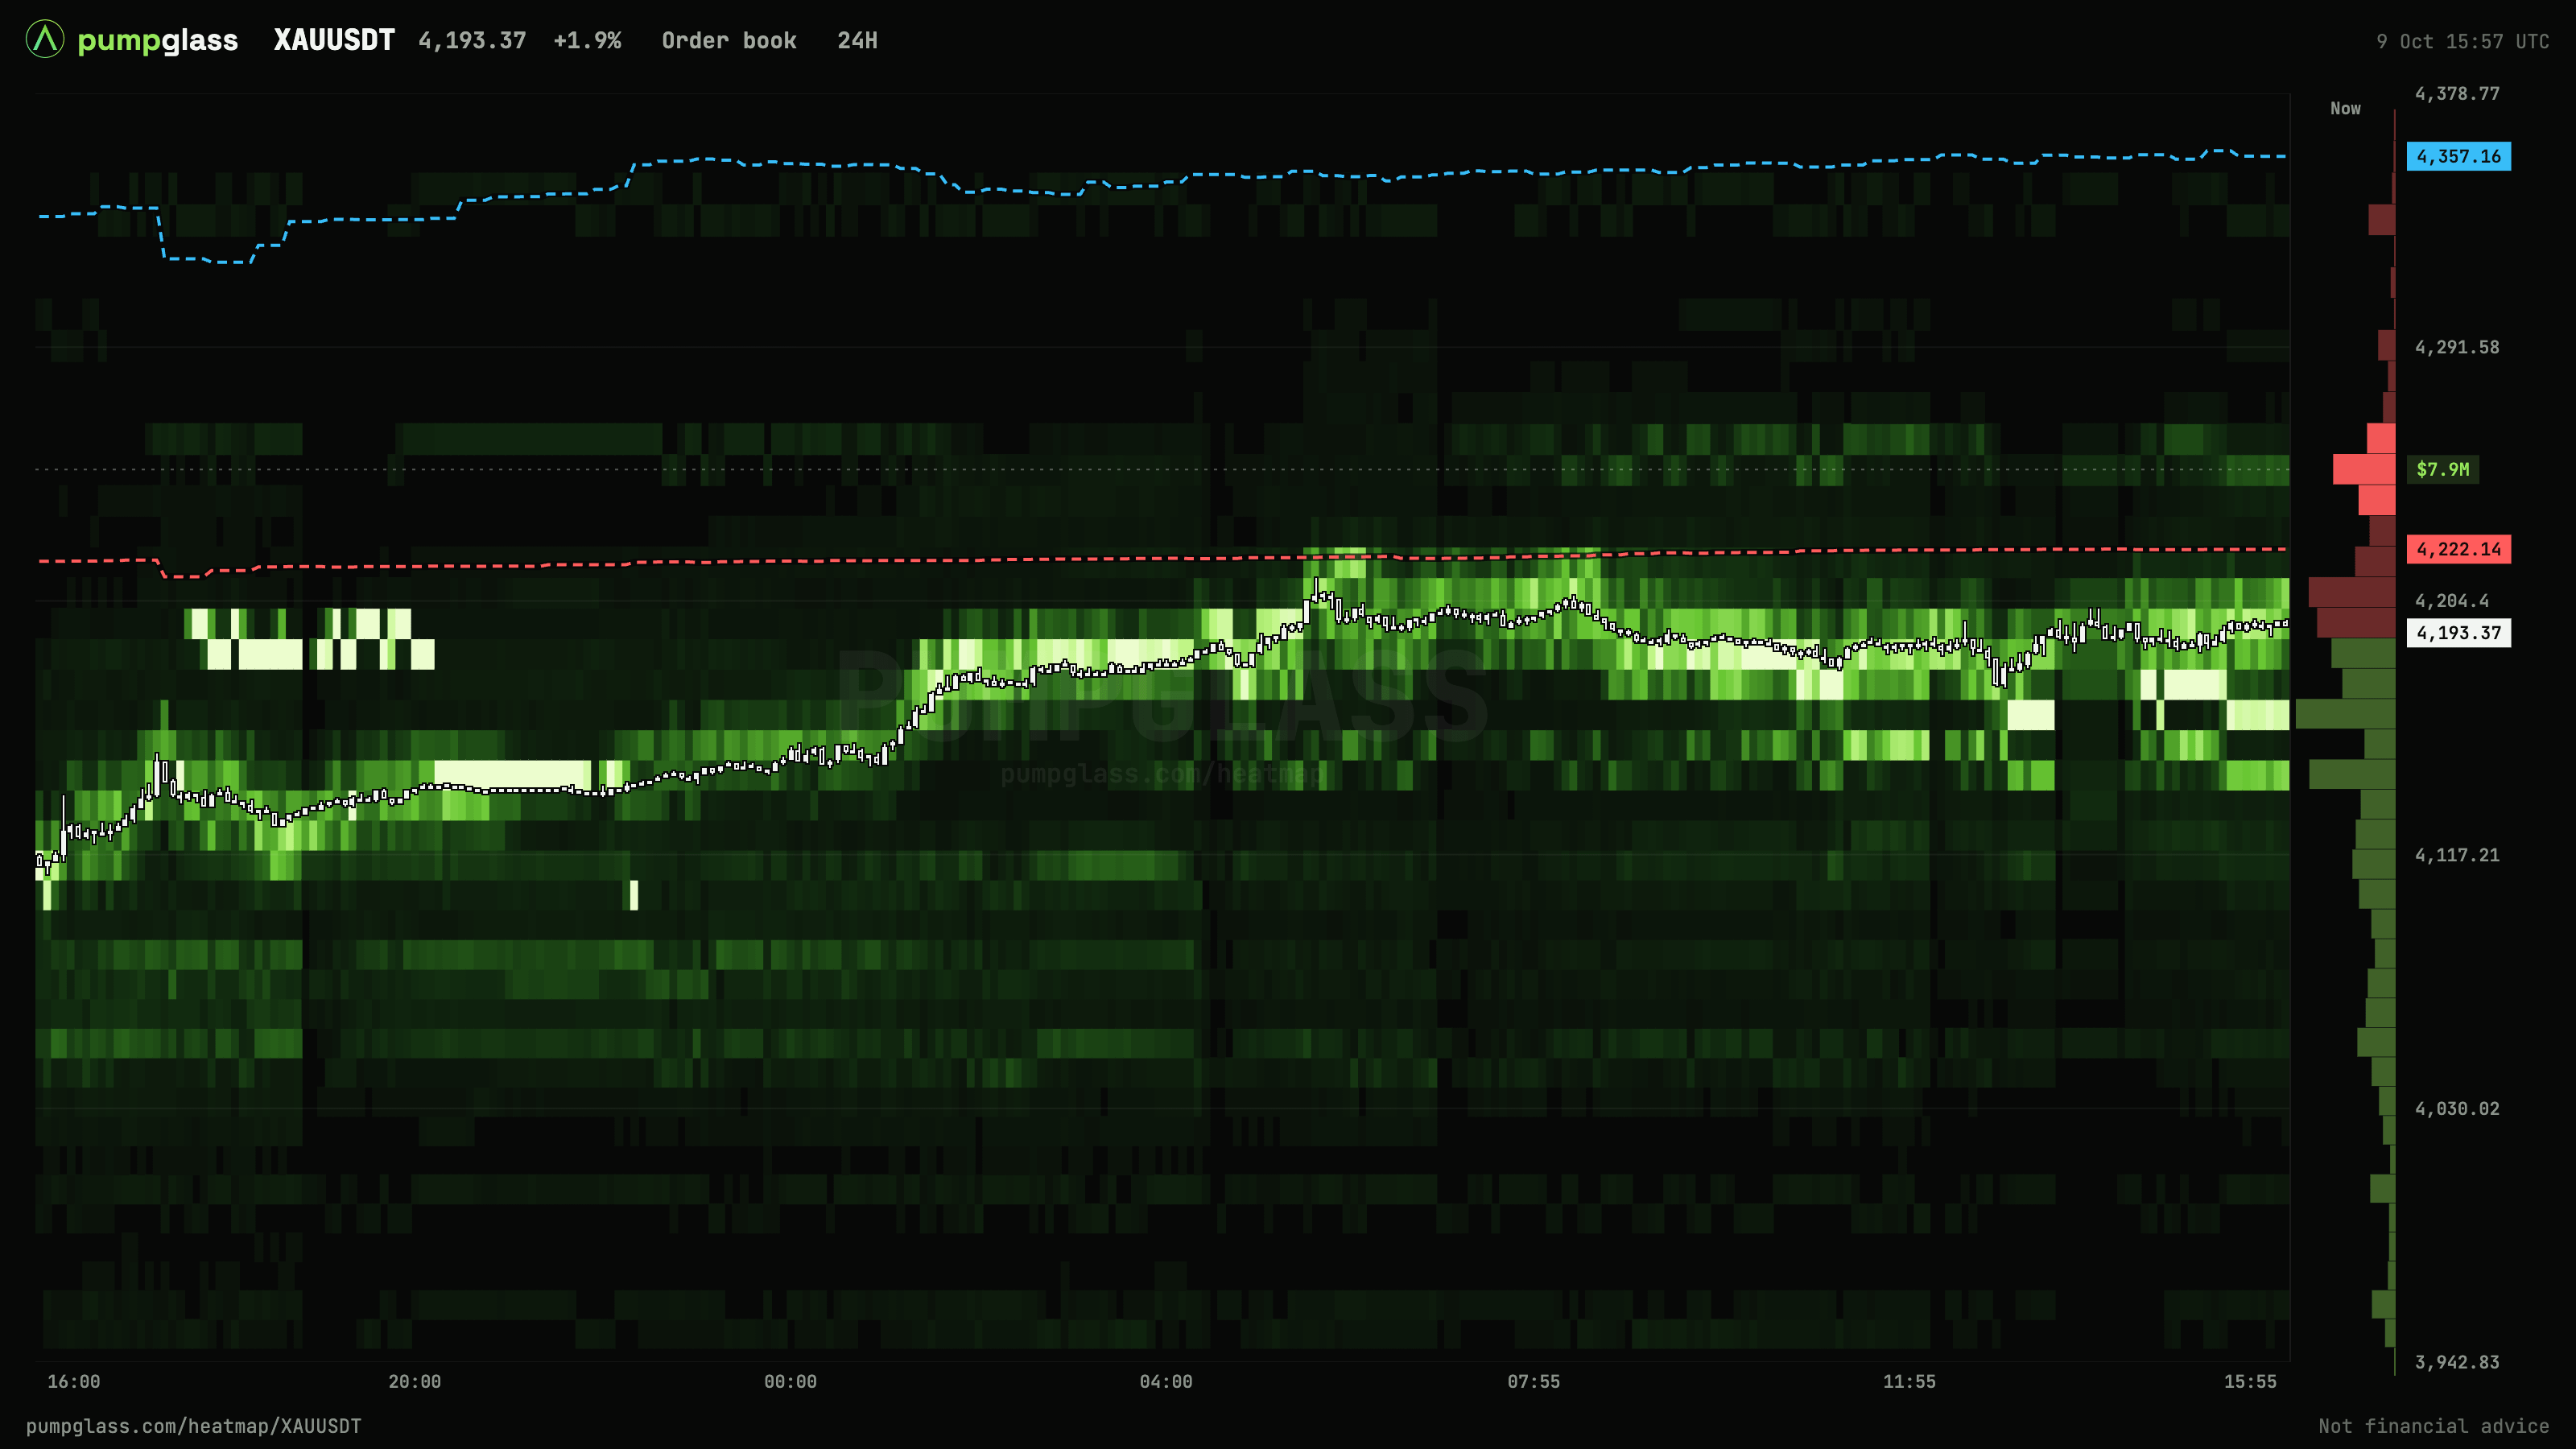
Whale average entries: on October 9 whales in longs were in at 4,357 on average, about 4% under water. Whales in shorts at 4,222, in profit.
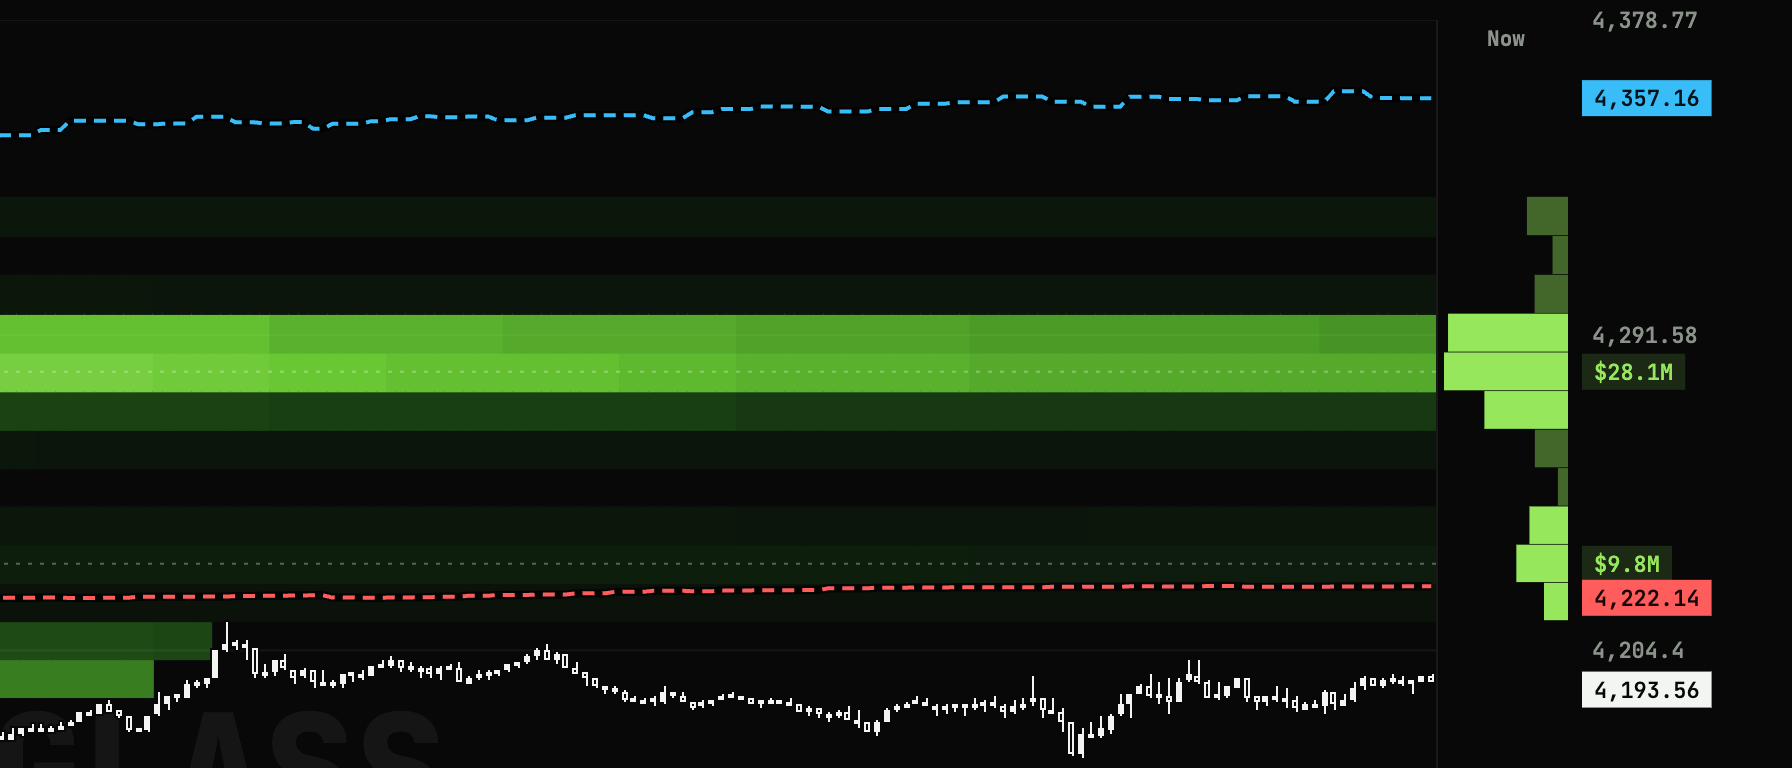
$$When a liquidation band, a buy wall and the whale entry line meet at one price, that is the zone to watch. If price arrives and the wall holds, the zone is defended. If the wall vanishes before contact, the cascade has an open road.
This guide is based on the free PumpGlass liquidation heatmap: liquidations, order book and whale entries on one chart, for gold, silver, oil and every Binance USDT-M pair. The full version with diagrams is in the PumpGlass Learn section.
#XAUUSDT #Gold #Liquidation #Futures #Binance