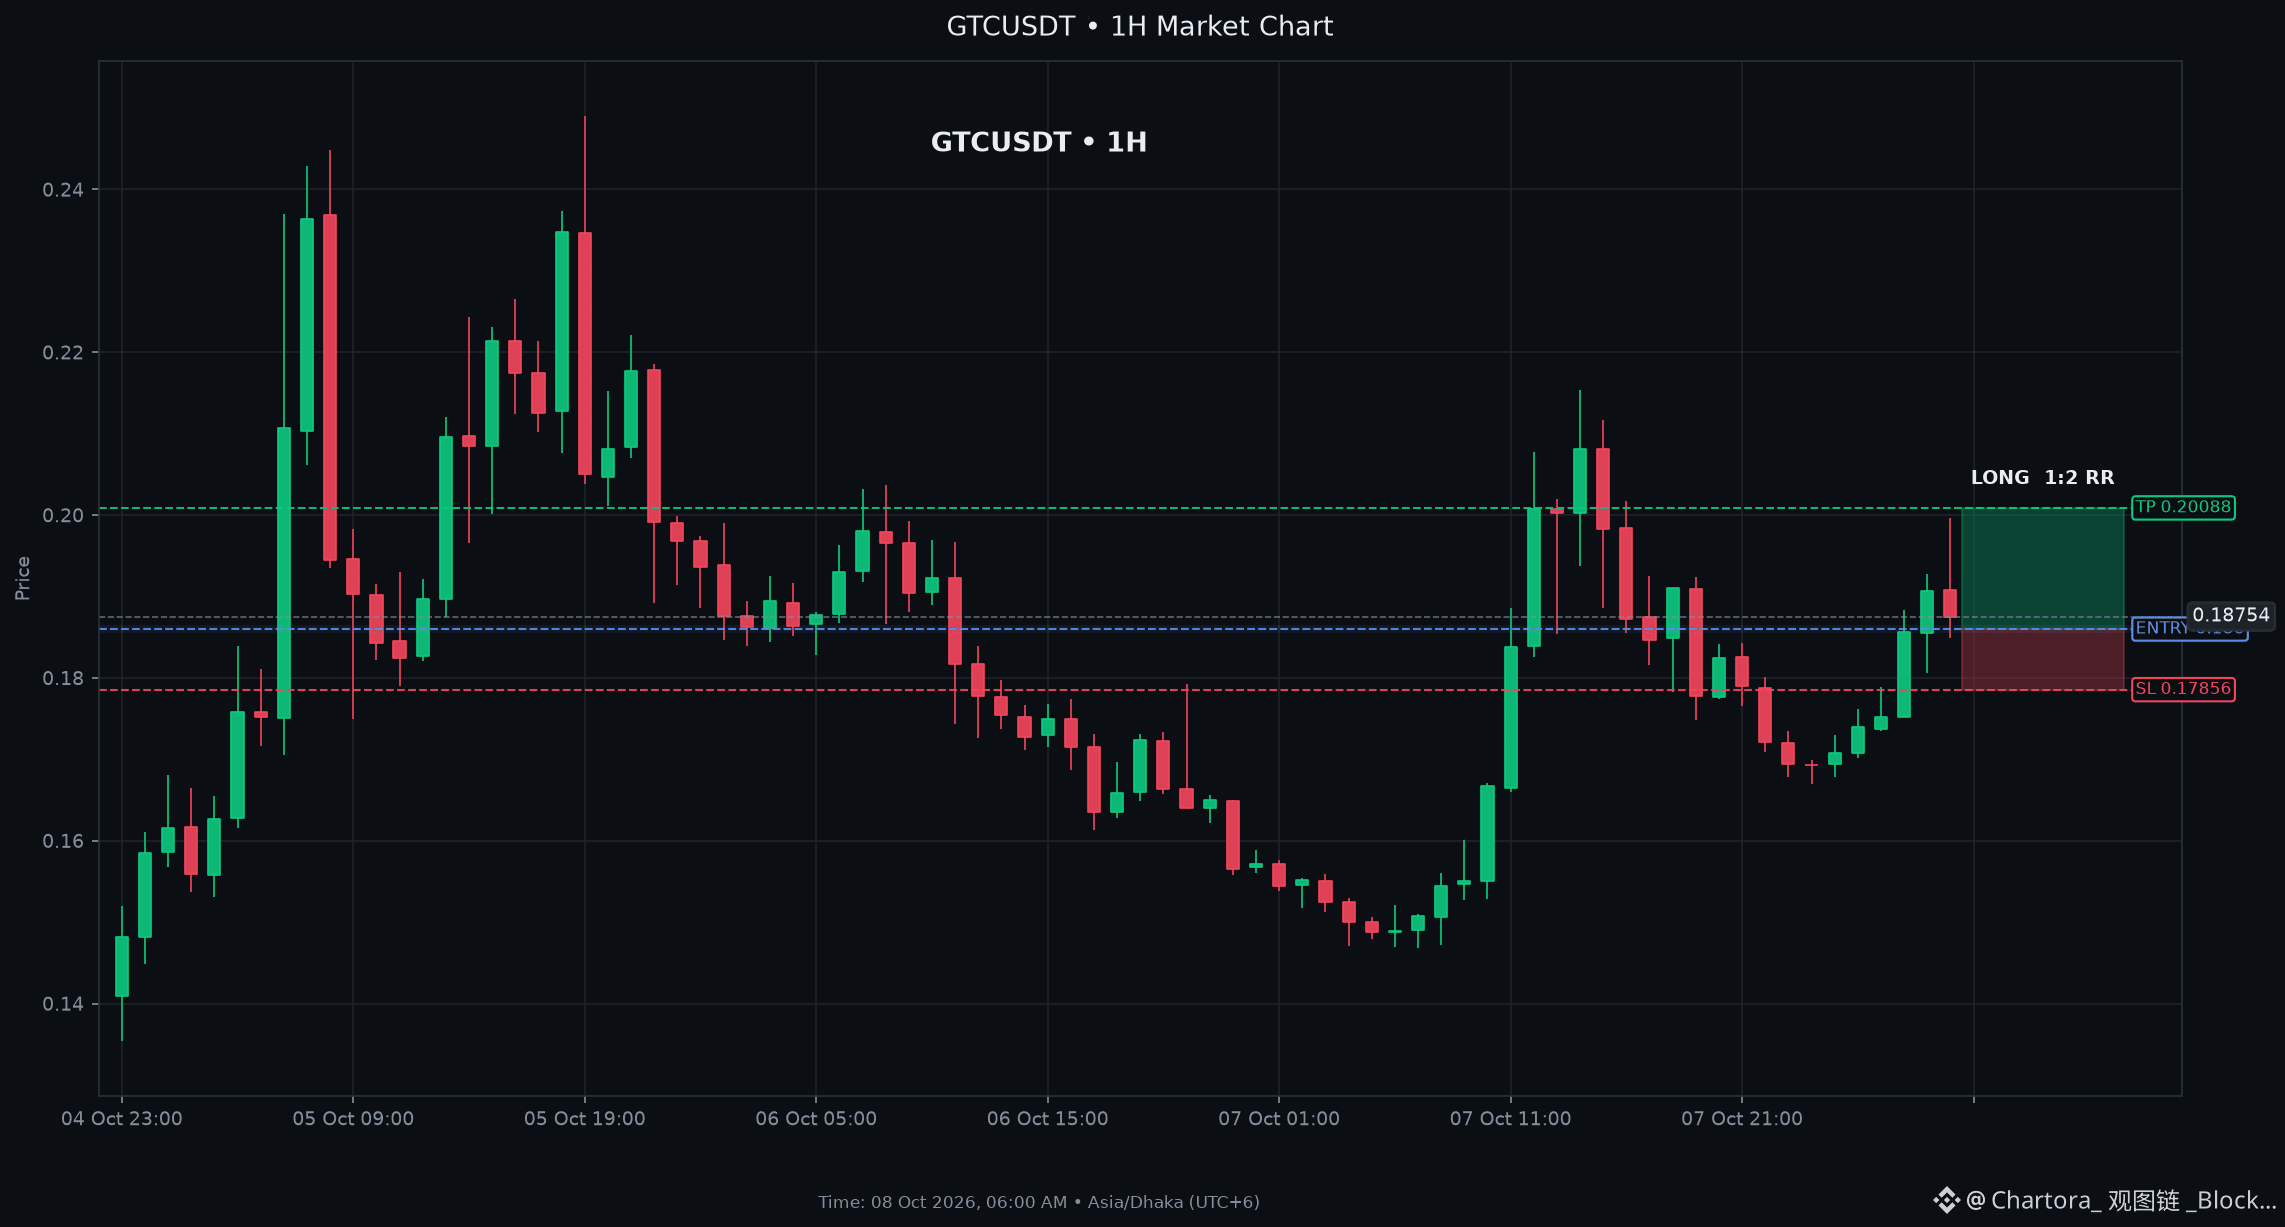
$GTC: Bullish Divergence Flashed on $GTC Daily Chart Structure
LONG SETUP GTC
Entry: $0.18550 - $0.18650
Stop Loss: $0.17856
Take Profit: $0.20088 (2R)
Key Levels: Support $0.18386 | Resistance $0.20367
Technical Analysis for $GTC: Price sits above EMA9, EMA21 and EMA50, showing bullish bias. MACD line is positive with a 0.0007 histogram, while RSI at 57 and Stochastic K at 63 confirm momentum. ADX 28 signals a strong trend. Orderbook imbalance favors buyers. Resistance near 0.1884 may cap upside; watch for a break above. A pullback to 0.18550.1865 offers a cleaner entry.
Market Context: BTC is down 2.4% on the 4hour chart, keeping the broader market broadly negative (82% red). GTCs upside comes despite the bearish
LONG $GTC
LONG SETUP GTC
Entry: $0.18550 - $0.18650
Stop Loss: $0.17856
Take Profit: $0.20088 (2R)
Key Levels: Support $0.18386 | Resistance $0.20367
Technical Analysis for $GTC: Price sits above EMA9, EMA21 and EMA50, showing bullish bias. MACD line is positive with a 0.0007 histogram, while RSI at 57 and Stochastic K at 63 confirm momentum. ADX 28 signals a strong trend. Orderbook imbalance favors buyers. Resistance near 0.1884 may cap upside; watch for a break above. A pullback to 0.18550.1865 offers a cleaner entry.
Market Context: BTC is down 2.4% on the 4hour chart, keeping the broader market broadly negative (82% red). GTCs upside comes despite the bearish
LONG $GTC