$PEPE: Weighing Volume Against Sentiment
The hourly direction for $PEPE is currently down while trading volume remains above its baseline. This specific combination suggests that active participation is occurring during a period of price softening. When volume expands as prices slip, it often indicates a period where supply is testing the immediate demand levels. One core mechanism to consider is the absorption rate. If buyers are willing to step in at lower prices, the high volume acts as a cushion, potentially slowing the descent. However, if that volume primarily represents aggressive selling, the structural support may weaken further.
Comparing this to other assets on the same venue reveals different dynamics. For instance, $ETH mirrors the downward hourly direction with high volume, while $NMR shows a downward direction without elevated activity. These differences highlight the limits of same-venue observations. A shared direction does not imply that these assets are moving for the same reason or that capital is moving between them. It simply shows how various tokens respond to the current market environment.
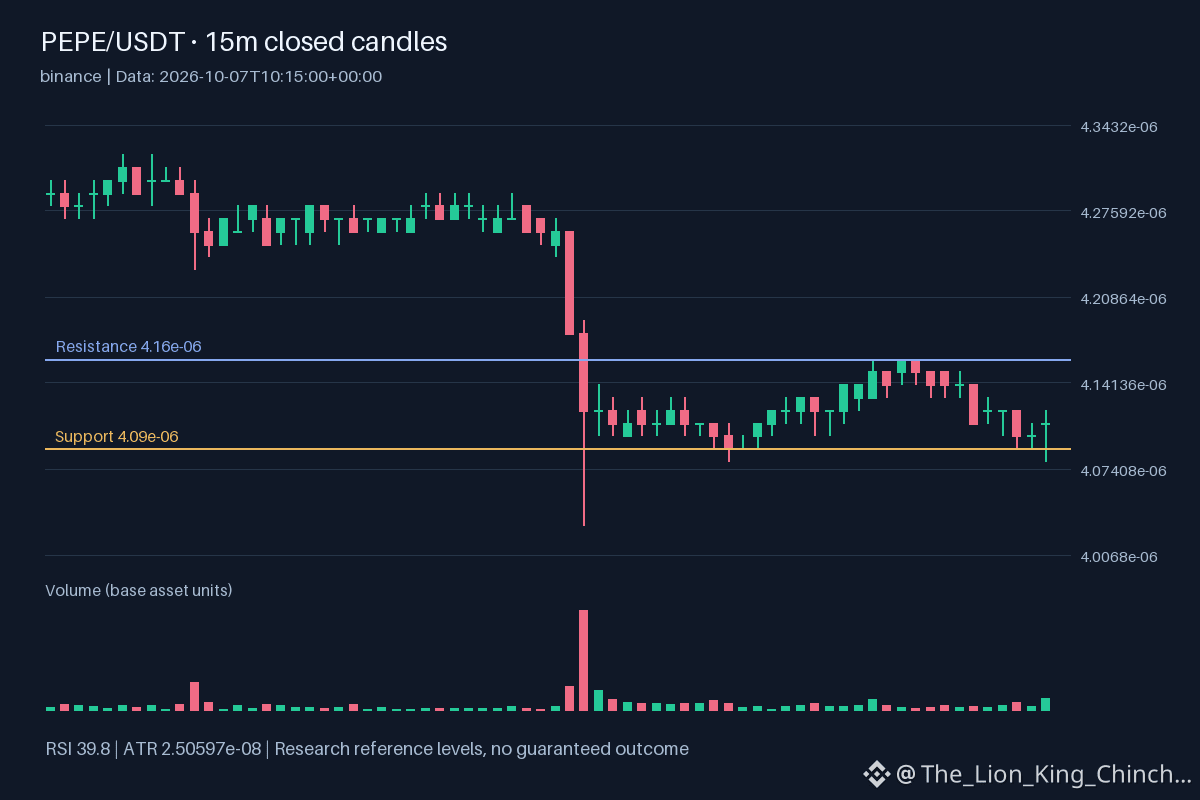
To reassess this interpretation, monitor if the RSI 39.821 begins to flatten while volume stays high. Such a shift could suggest that the selling pressure is exhausting itself. Conversely, if the MACD -1.3788e-08 continues to diverge below the signal -1.35433e-08, the current downward pressure might persist despite the high participation levels. Observing how $PEPE reacts near the support 4.09e-06 compared to the resistance 4.16e-06 will provide more clarity on whether the asset is maintaining its structure or entering a deeper correction phase. 📉
Probabilistic market research, not a recommendation or guaranteed return.
For a wider view: $ETH has hourly direction down and volume above its baseline; $NMR has hourly direction down and volume not above its baseline. This alone does not establish correlation.
Would you focus on the leader or the asset holding its structure?
#PEPE
The hourly direction for $PEPE is currently down while trading volume remains above its baseline. This specific combination suggests that active participation is occurring during a period of price softening. When volume expands as prices slip, it often indicates a period where supply is testing the immediate demand levels. One core mechanism to consider is the absorption rate. If buyers are willing to step in at lower prices, the high volume acts as a cushion, potentially slowing the descent. However, if that volume primarily represents aggressive selling, the structural support may weaken further.
Comparing this to other assets on the same venue reveals different dynamics. For instance, $ETH mirrors the downward hourly direction with high volume, while $NMR shows a downward direction without elevated activity. These differences highlight the limits of same-venue observations. A shared direction does not imply that these assets are moving for the same reason or that capital is moving between them. It simply shows how various tokens respond to the current market environment.
To reassess this interpretation, monitor if the RSI 39.821 begins to flatten while volume stays high. Such a shift could suggest that the selling pressure is exhausting itself. Conversely, if the MACD -1.3788e-08 continues to diverge below the signal -1.35433e-08, the current downward pressure might persist despite the high participation levels. Observing how $PEPE reacts near the support 4.09e-06 compared to the resistance 4.16e-06 will provide more clarity on whether the asset is maintaining its structure or entering a deeper correction phase. 📉
Probabilistic market research, not a recommendation or guaranteed return.
For a wider view: $ETH has hourly direction down and volume above its baseline; $NMR has hourly direction down and volume not above its baseline. This alone does not establish correlation.
Would you focus on the leader or the asset holding its structure?
#PEPE