#BinanceLaunchesBinanceIntelligence
Important Resistance Areas
The main levels visible are:
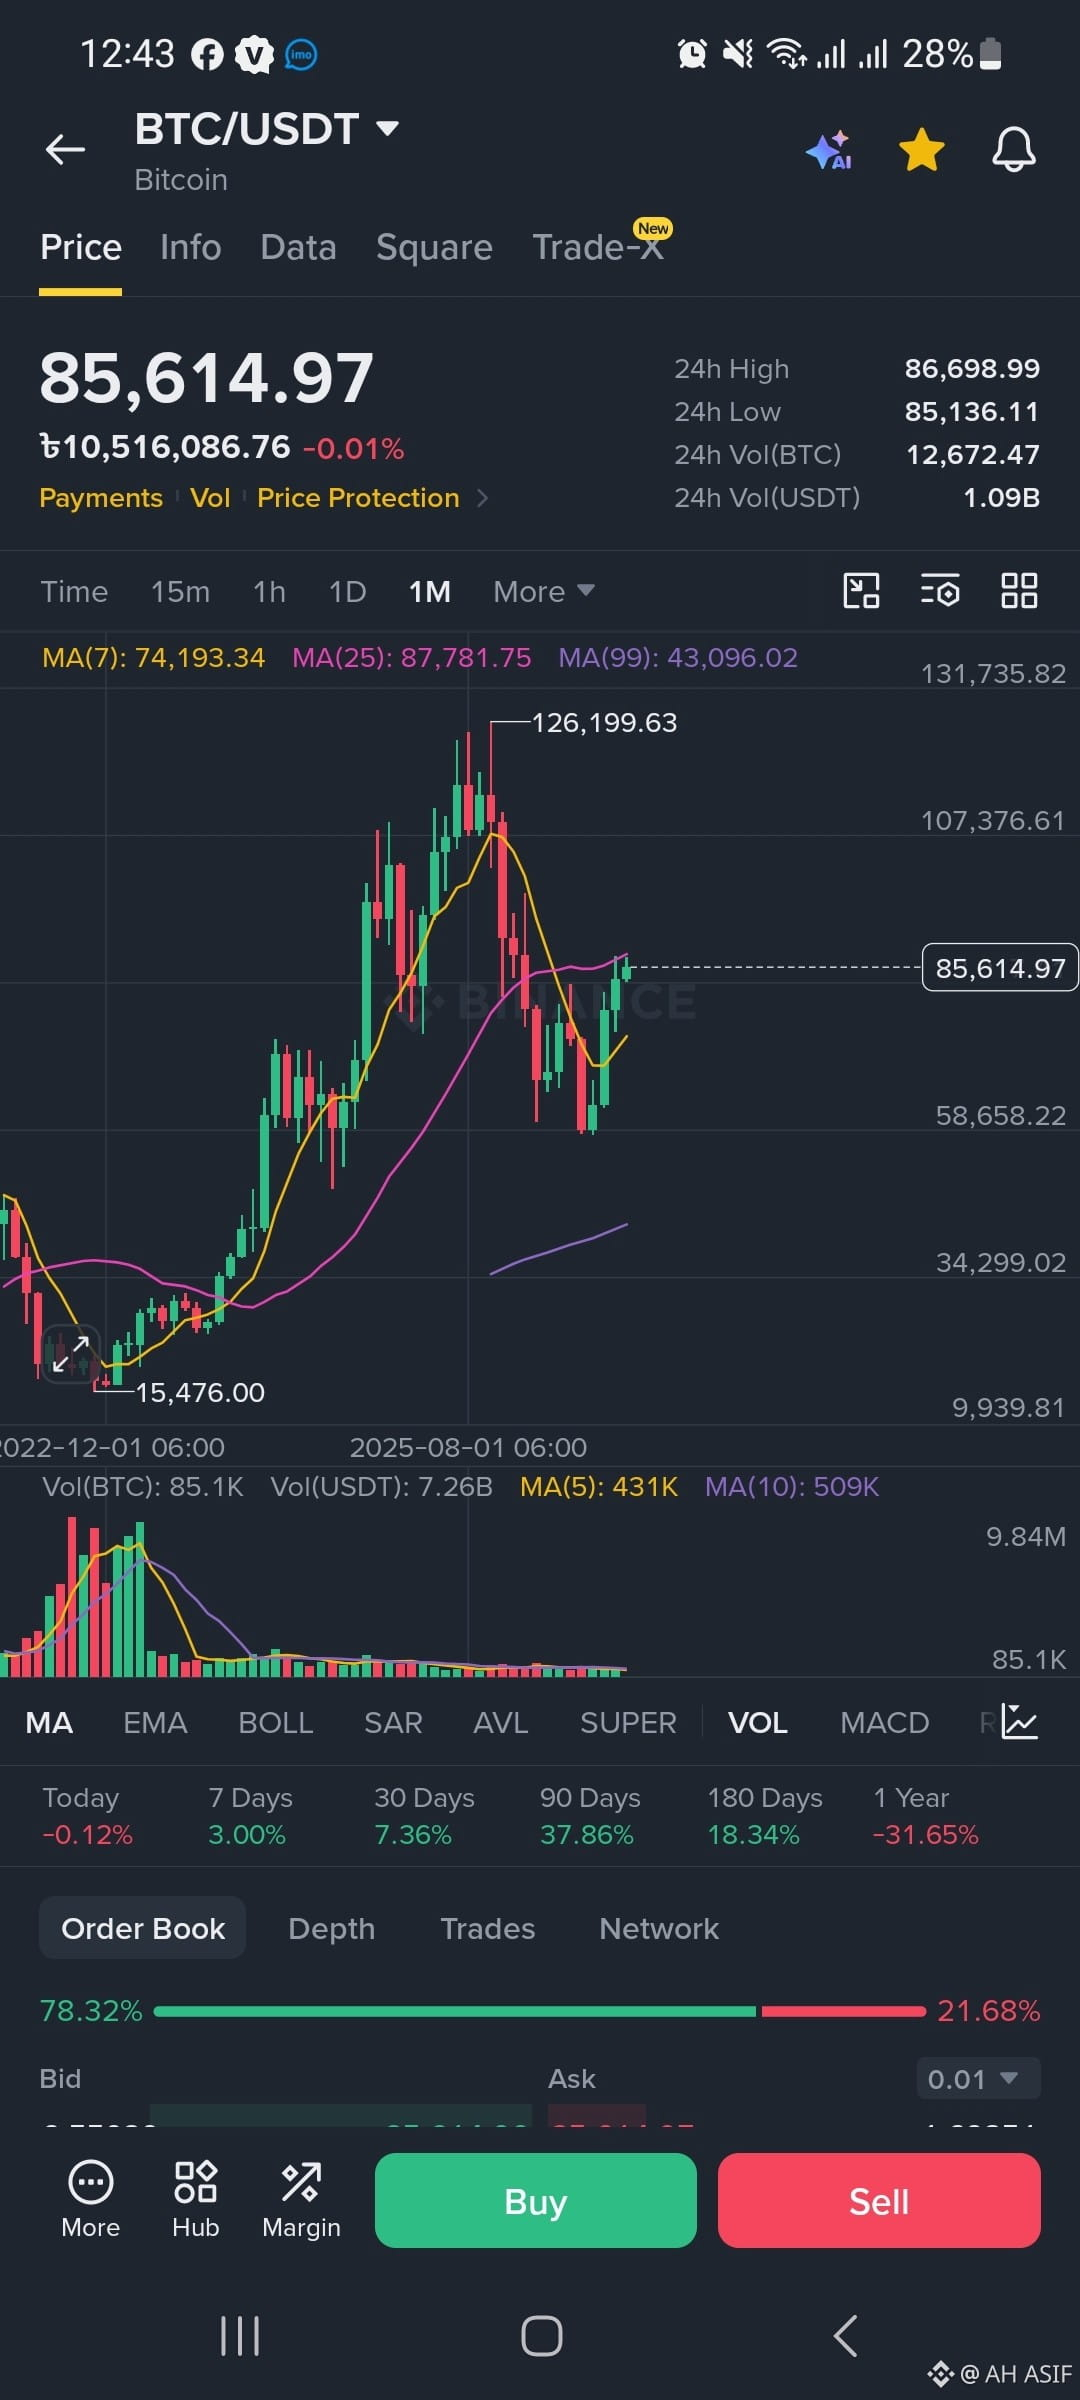
$86.7K: Current 24-hour high
$87.8K: MA(25)
$100K+: Psychological/technical resistance area
$107K: Major chart level
$126.2K: Previous major high shown on the chart
A sustained move above $87K–$88K would make the chart look stronger. A move toward the previous high would require BTC to overcome several resistance areas along the way.
📊 Volume
The volume shown at the bottom has become much smaller compared with the huge volume during the earlier major price movements.
That means the current recovery should be watched together with volume confirmation. A strong price breakout accompanied by increasing volume is generally more convincing than a breakout with weak volume.
Important Resistance Areas
The main levels visible are:
$86.7K: Current 24-hour high
$87.8K: MA(25)
$100K+: Psychological/technical resistance area
$107K: Major chart level
$126.2K: Previous major high shown on the chart
A sustained move above $87K–$88K would make the chart look stronger. A move toward the previous high would require BTC to overcome several resistance areas along the way.
📊 Volume
The volume shown at the bottom has become much smaller compared with the huge volume during the earlier major price movements.
That means the current recovery should be watched together with volume confirmation. A strong price breakout accompanied by increasing volume is generally more convincing than a breakout with weak volume.