Sure. Here is a detailed English analysis of the BTC/USDT chart in your screenshot:
📊 Bitcoin (BTC/USDT) — Chart Analysis
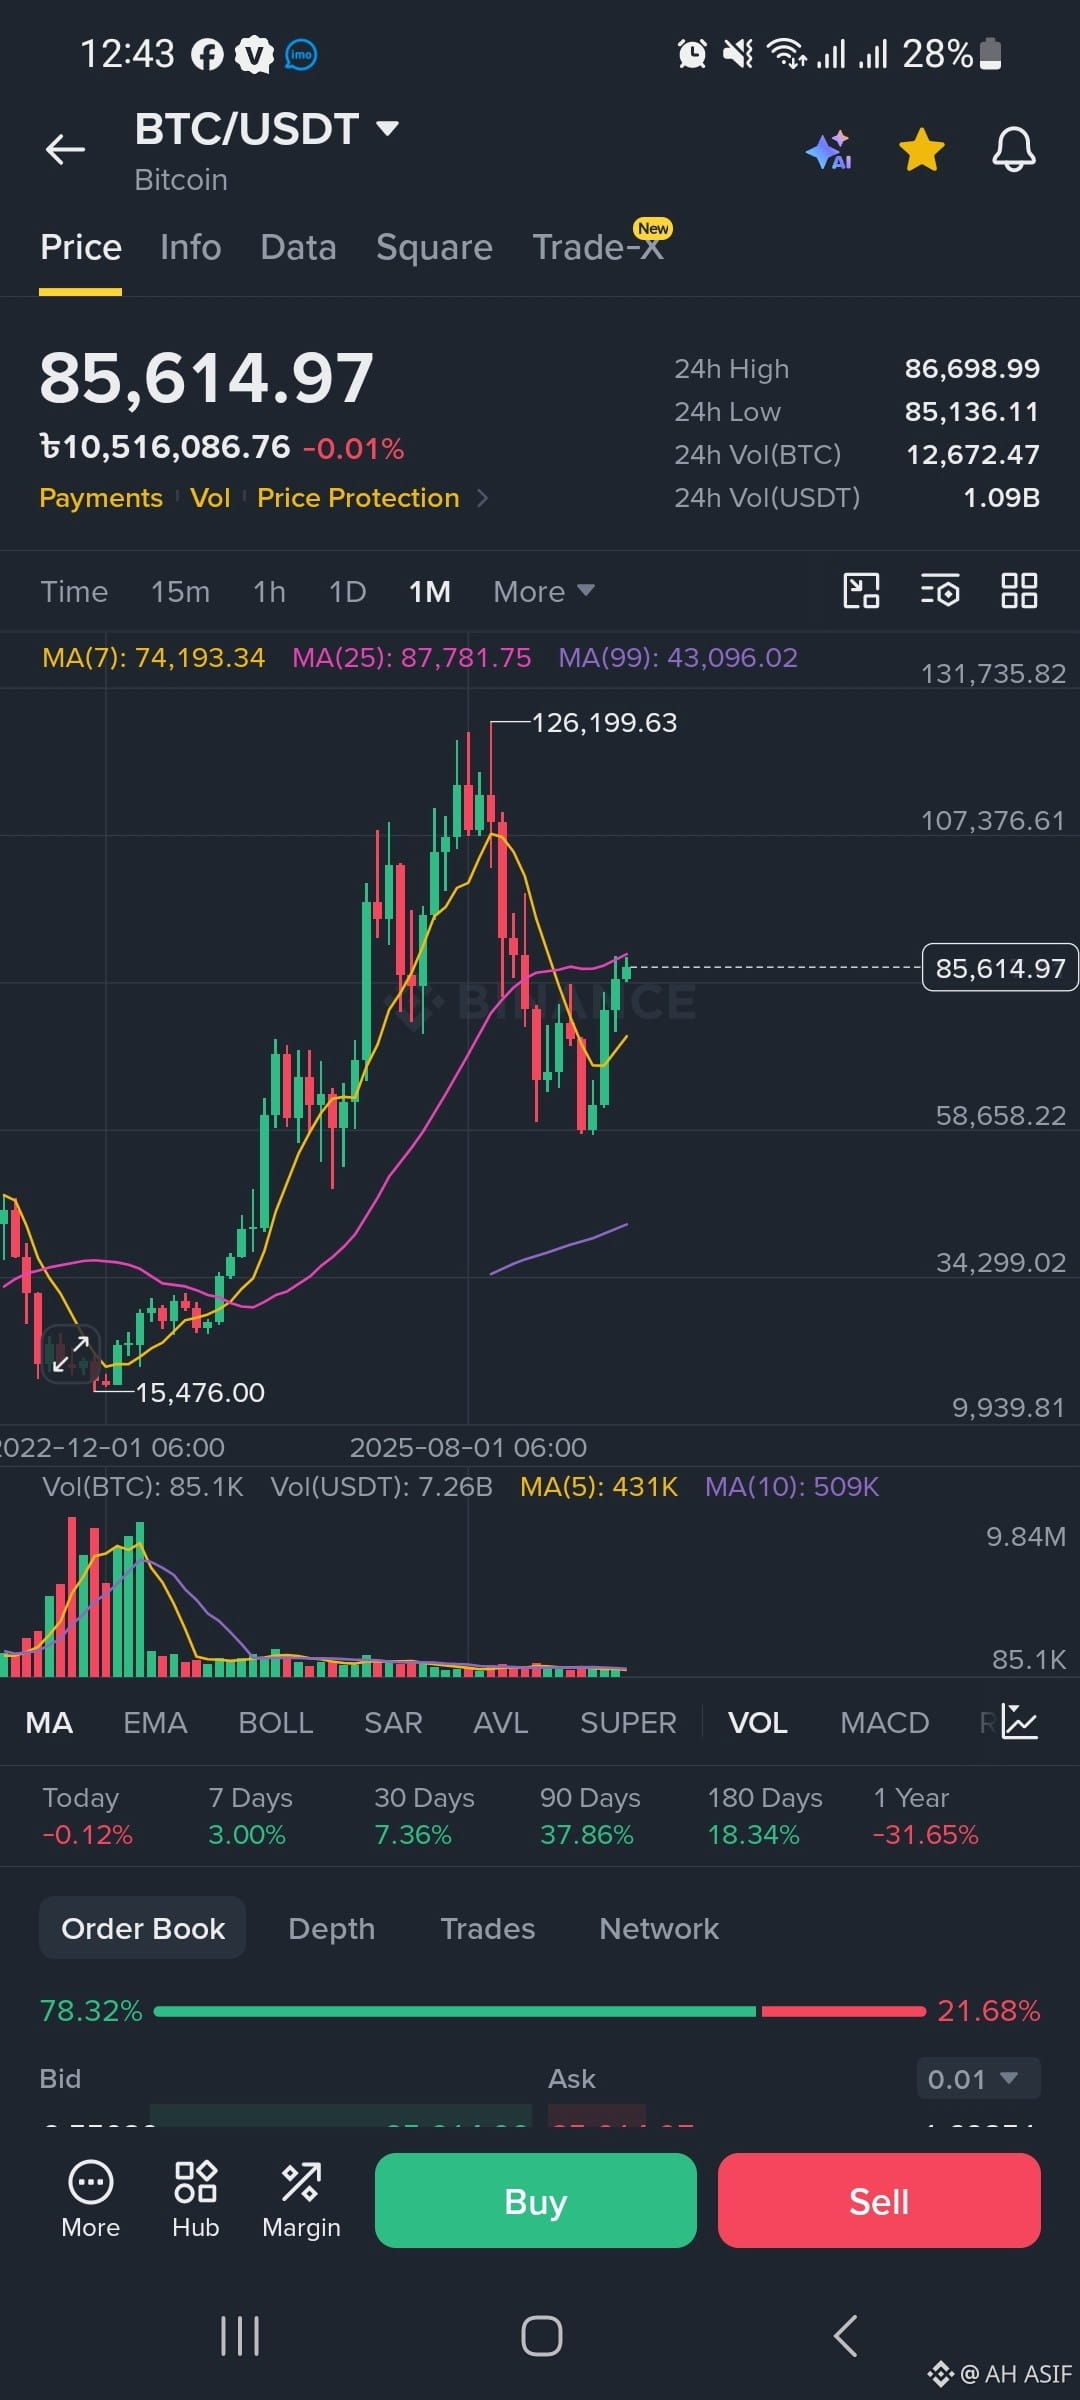
The screenshot shows Bitcoin trading around $85,614.97 against USDT.
Current price: $85,614.97
24H High: $86,698.99
24H Low: $85,136.11
24H Volume: ~12,672 BTC / $1.09B USDT
🕯️ Timeframe: 1 Month (1M)
This is a monthly candlestick chart, so each candle represents approximately one month. That means the chart is useful for understanding the long-term trend, rather than short-term entries.
Bitcoin previously reached a major high of approximately $126,199.63 on this chart. After that peak, BTC experienced a significant correction and dropped toward the $58,000 area.
More recently, BTC has recovered strongly from that region and is now around $85.6K.
📈 Moving Averages
The screenshot shows:
MA(7): $74,193
MA(25): $87,781
MA(99): $43,096
The current price is above the MA(7), which is generally a positive sign for the shorter part of this monthly trend.
However, BTC is currently slightly below the MA(25) at ~$87,782. That makes the $87K–$88K area important resistance.
The MA(99) is much lower, around $43K, indicating that the longer-term structure shown on this chart remains considerably higher than that average.
🟢 Important Support Areas
Based on the visible chart, some important areas to watch are:
$85K: Current area
$80K–$82K: Potential near-term support
$74K: MA(7) support area
$58K–$60K: Major previous support zone
If BTC continues falling, the $58K–$60K region would be much more significant than the smaller short-term levels.
📊 Bitcoin (BTC/USDT) — Chart Analysis
The screenshot shows Bitcoin trading around $85,614.97 against USDT.
Current price: $85,614.97
24H High: $86,698.99
24H Low: $85,136.11
24H Volume: ~12,672 BTC / $1.09B USDT
🕯️ Timeframe: 1 Month (1M)
This is a monthly candlestick chart, so each candle represents approximately one month. That means the chart is useful for understanding the long-term trend, rather than short-term entries.
Bitcoin previously reached a major high of approximately $126,199.63 on this chart. After that peak, BTC experienced a significant correction and dropped toward the $58,000 area.
More recently, BTC has recovered strongly from that region and is now around $85.6K.
📈 Moving Averages
The screenshot shows:
MA(7): $74,193
MA(25): $87,781
MA(99): $43,096
The current price is above the MA(7), which is generally a positive sign for the shorter part of this monthly trend.
However, BTC is currently slightly below the MA(25) at ~$87,782. That makes the $87K–$88K area important resistance.
The MA(99) is much lower, around $43K, indicating that the longer-term structure shown on this chart remains considerably higher than that average.
🟢 Important Support Areas
Based on the visible chart, some important areas to watch are:
$85K: Current area
$80K–$82K: Potential near-term support
$74K: MA(7) support area
$58K–$60K: Major previous support zone
If BTC continues falling, the $58K–$60K region would be much more significant than the smaller short-term levels.