
⚡ $QNT RANGE IS TIGHTENING AFTER THE EXPLOSIVE RALLY.
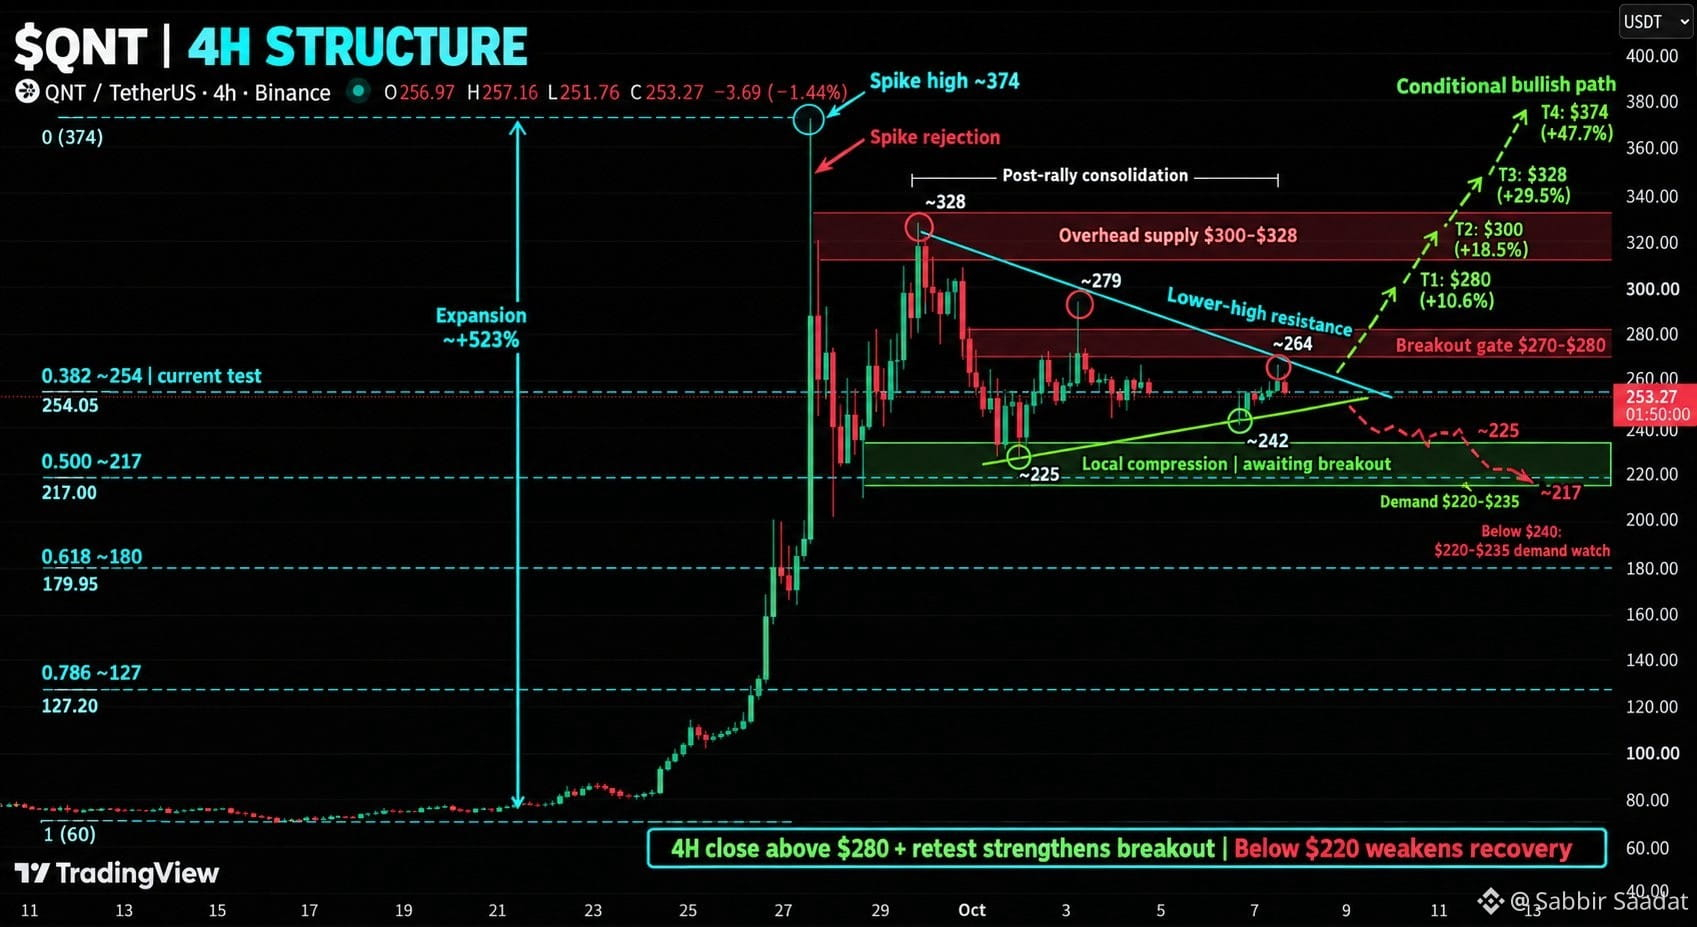
The 4H chart shows descending resistance meeting rising local support near $253, right around the 0.382 Fibonacci retracement.
A close above $280 followed by a successful retest would strengthen the breakout setup toward $300 and $328.
The ~$374 spike high sits another 47.7% above the chart’s current price.
Lose $240 and the $220–$235 demand zone comes into focus. Below $220, the recovery structure weakens.
The 4H chart shows descending resistance meeting rising local support near $253, right around the 0.382 Fibonacci retracement.
A close above $280 followed by a successful retest would strengthen the breakout setup toward $300 and $328.
The ~$374 spike high sits another 47.7% above the chart’s current price.
Lose $240 and the $220–$235 demand zone comes into focus. Below $220, the recovery structure weakens.