SOL looks to retest the daily highs
🟢 LONG $SOL /USDT: expecting price to go UP
Bias: LONG · Leaning
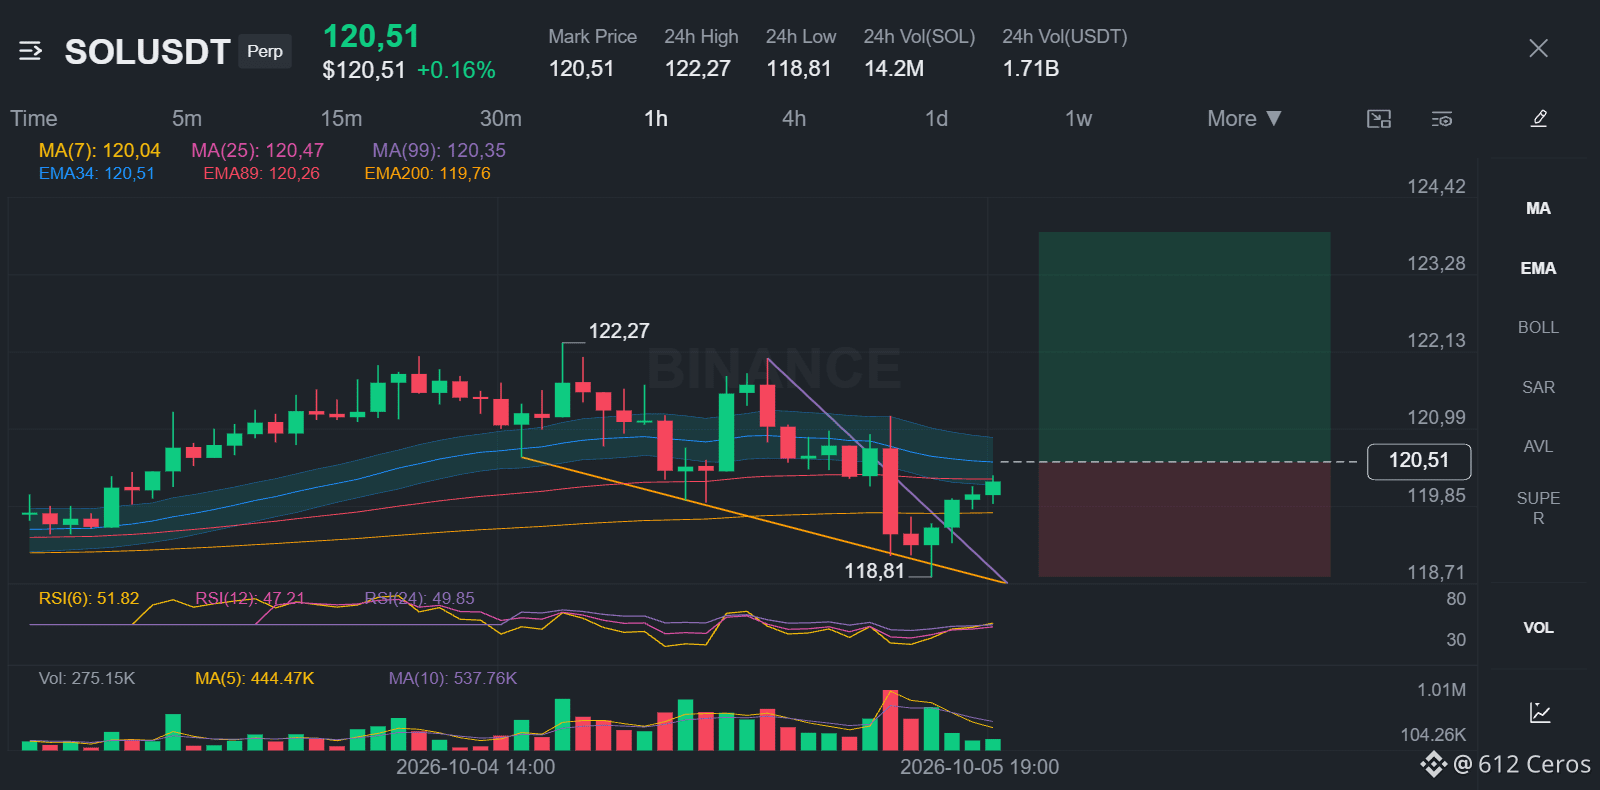
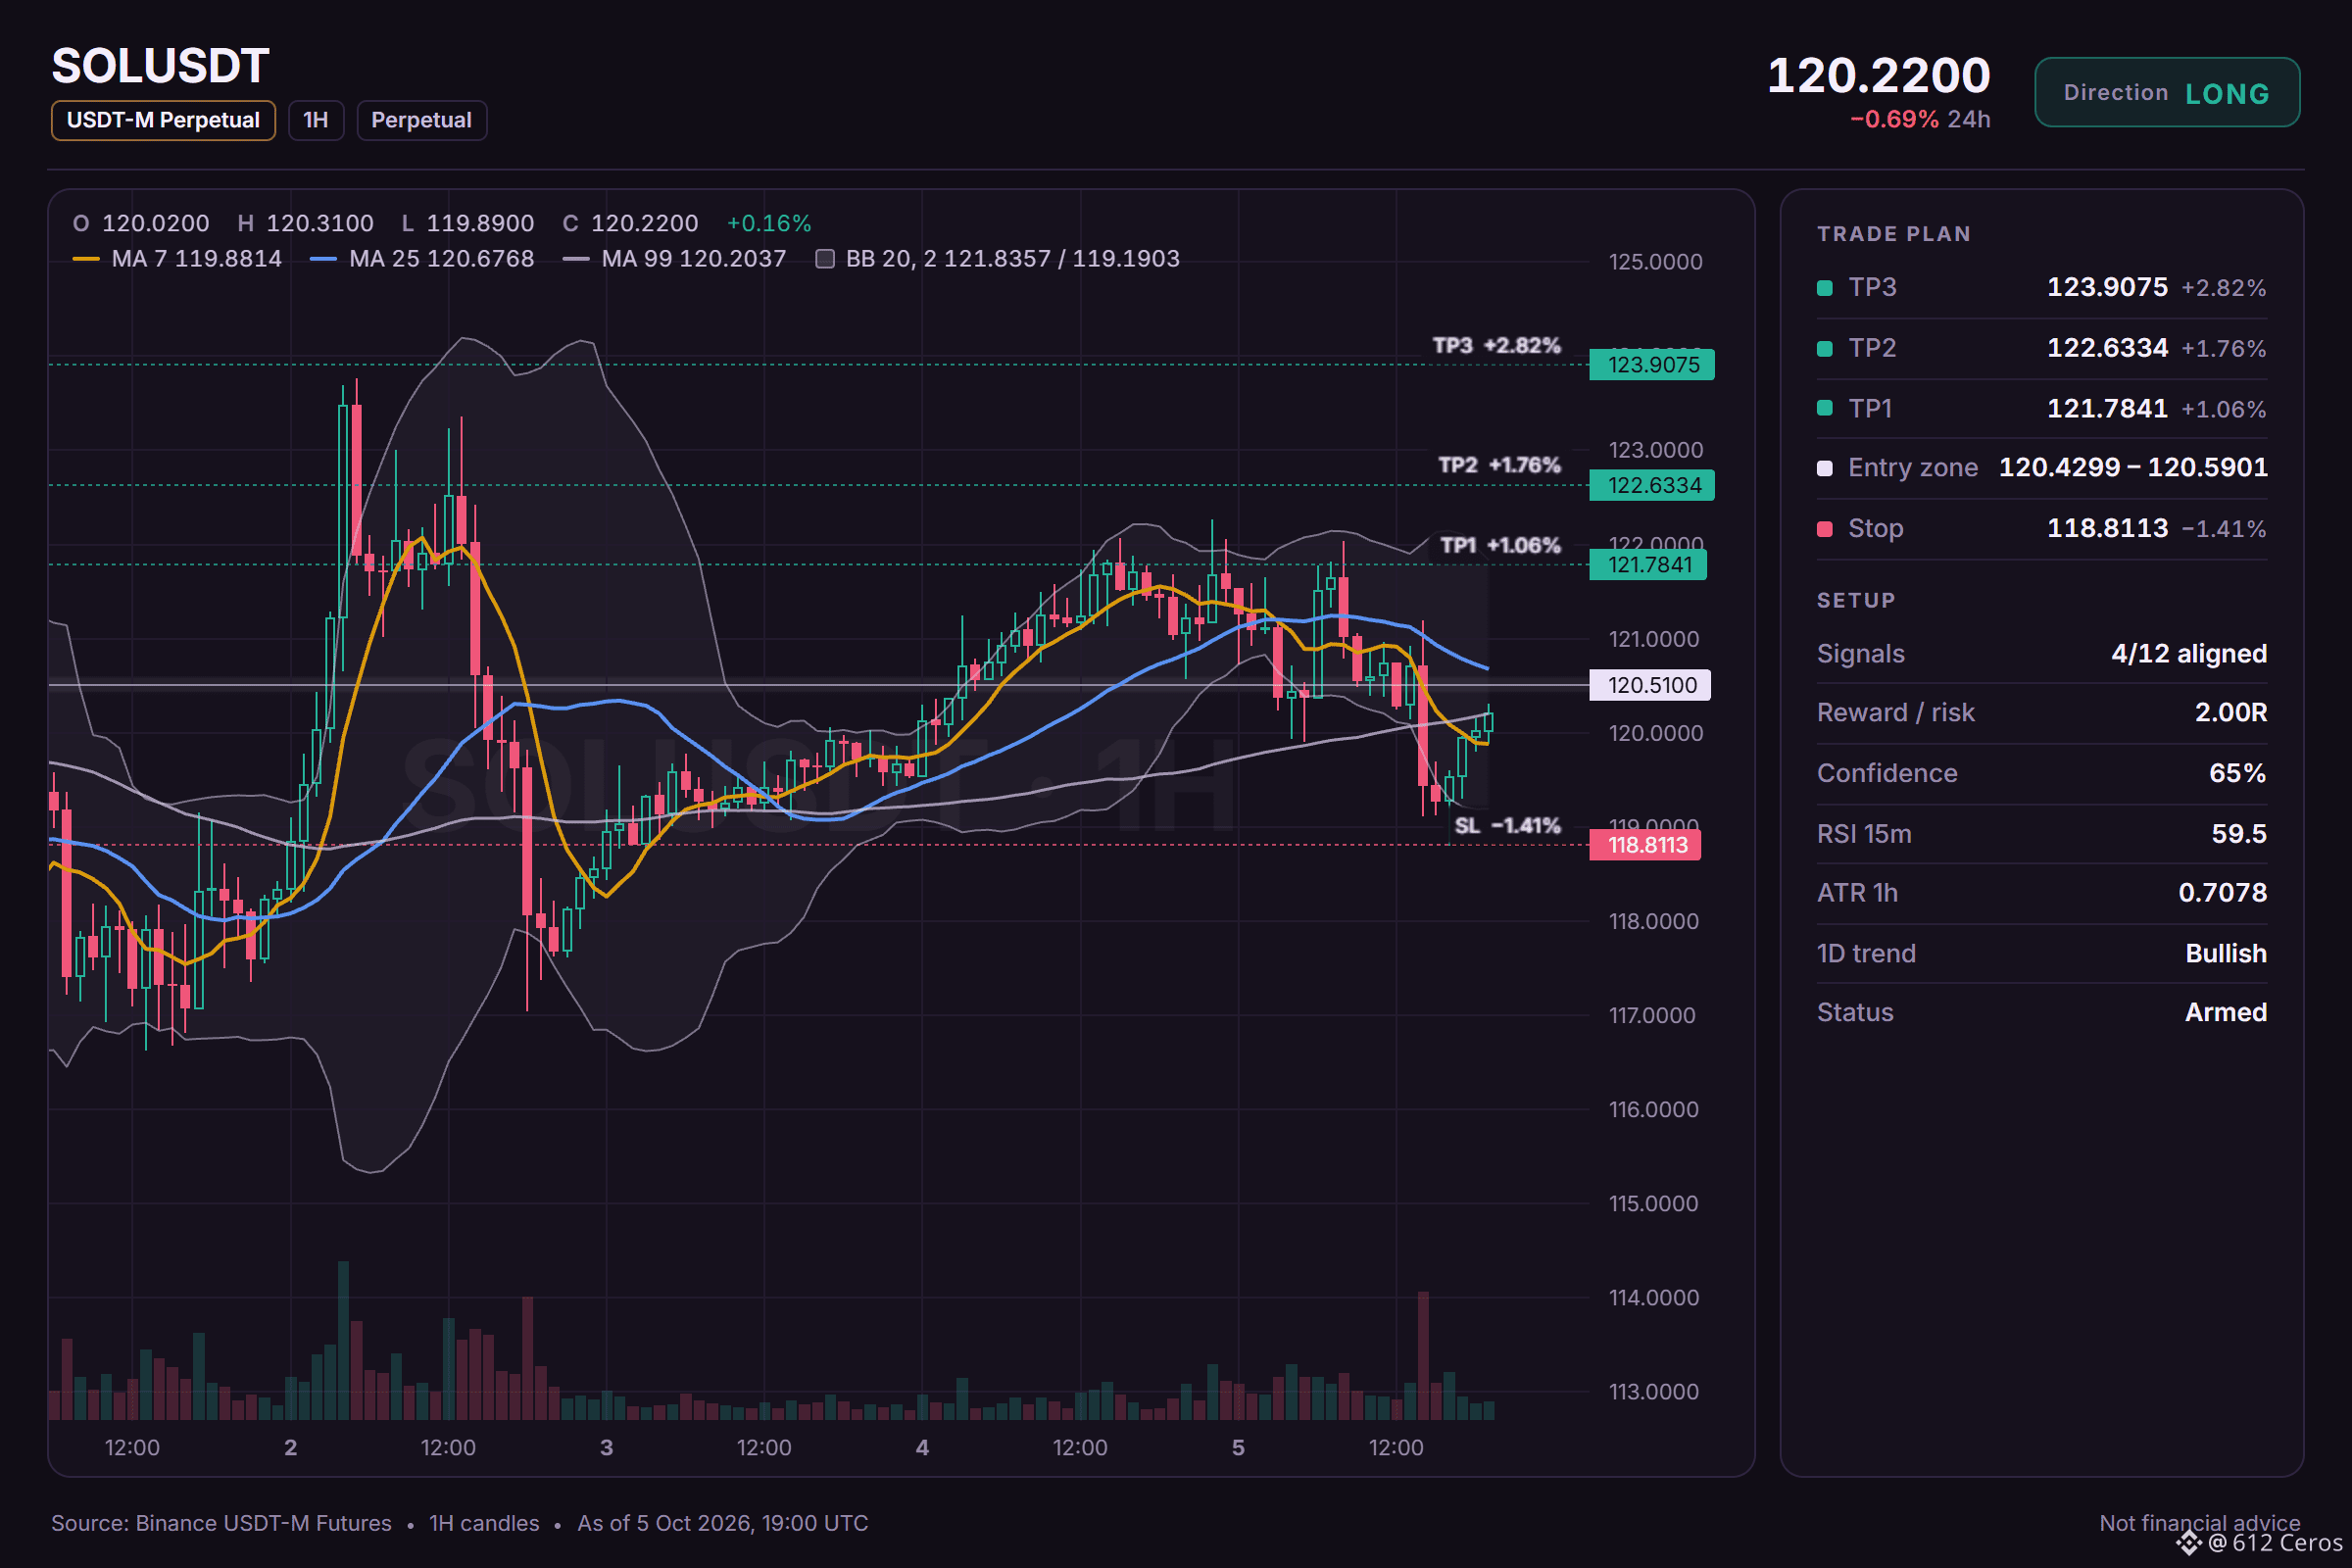
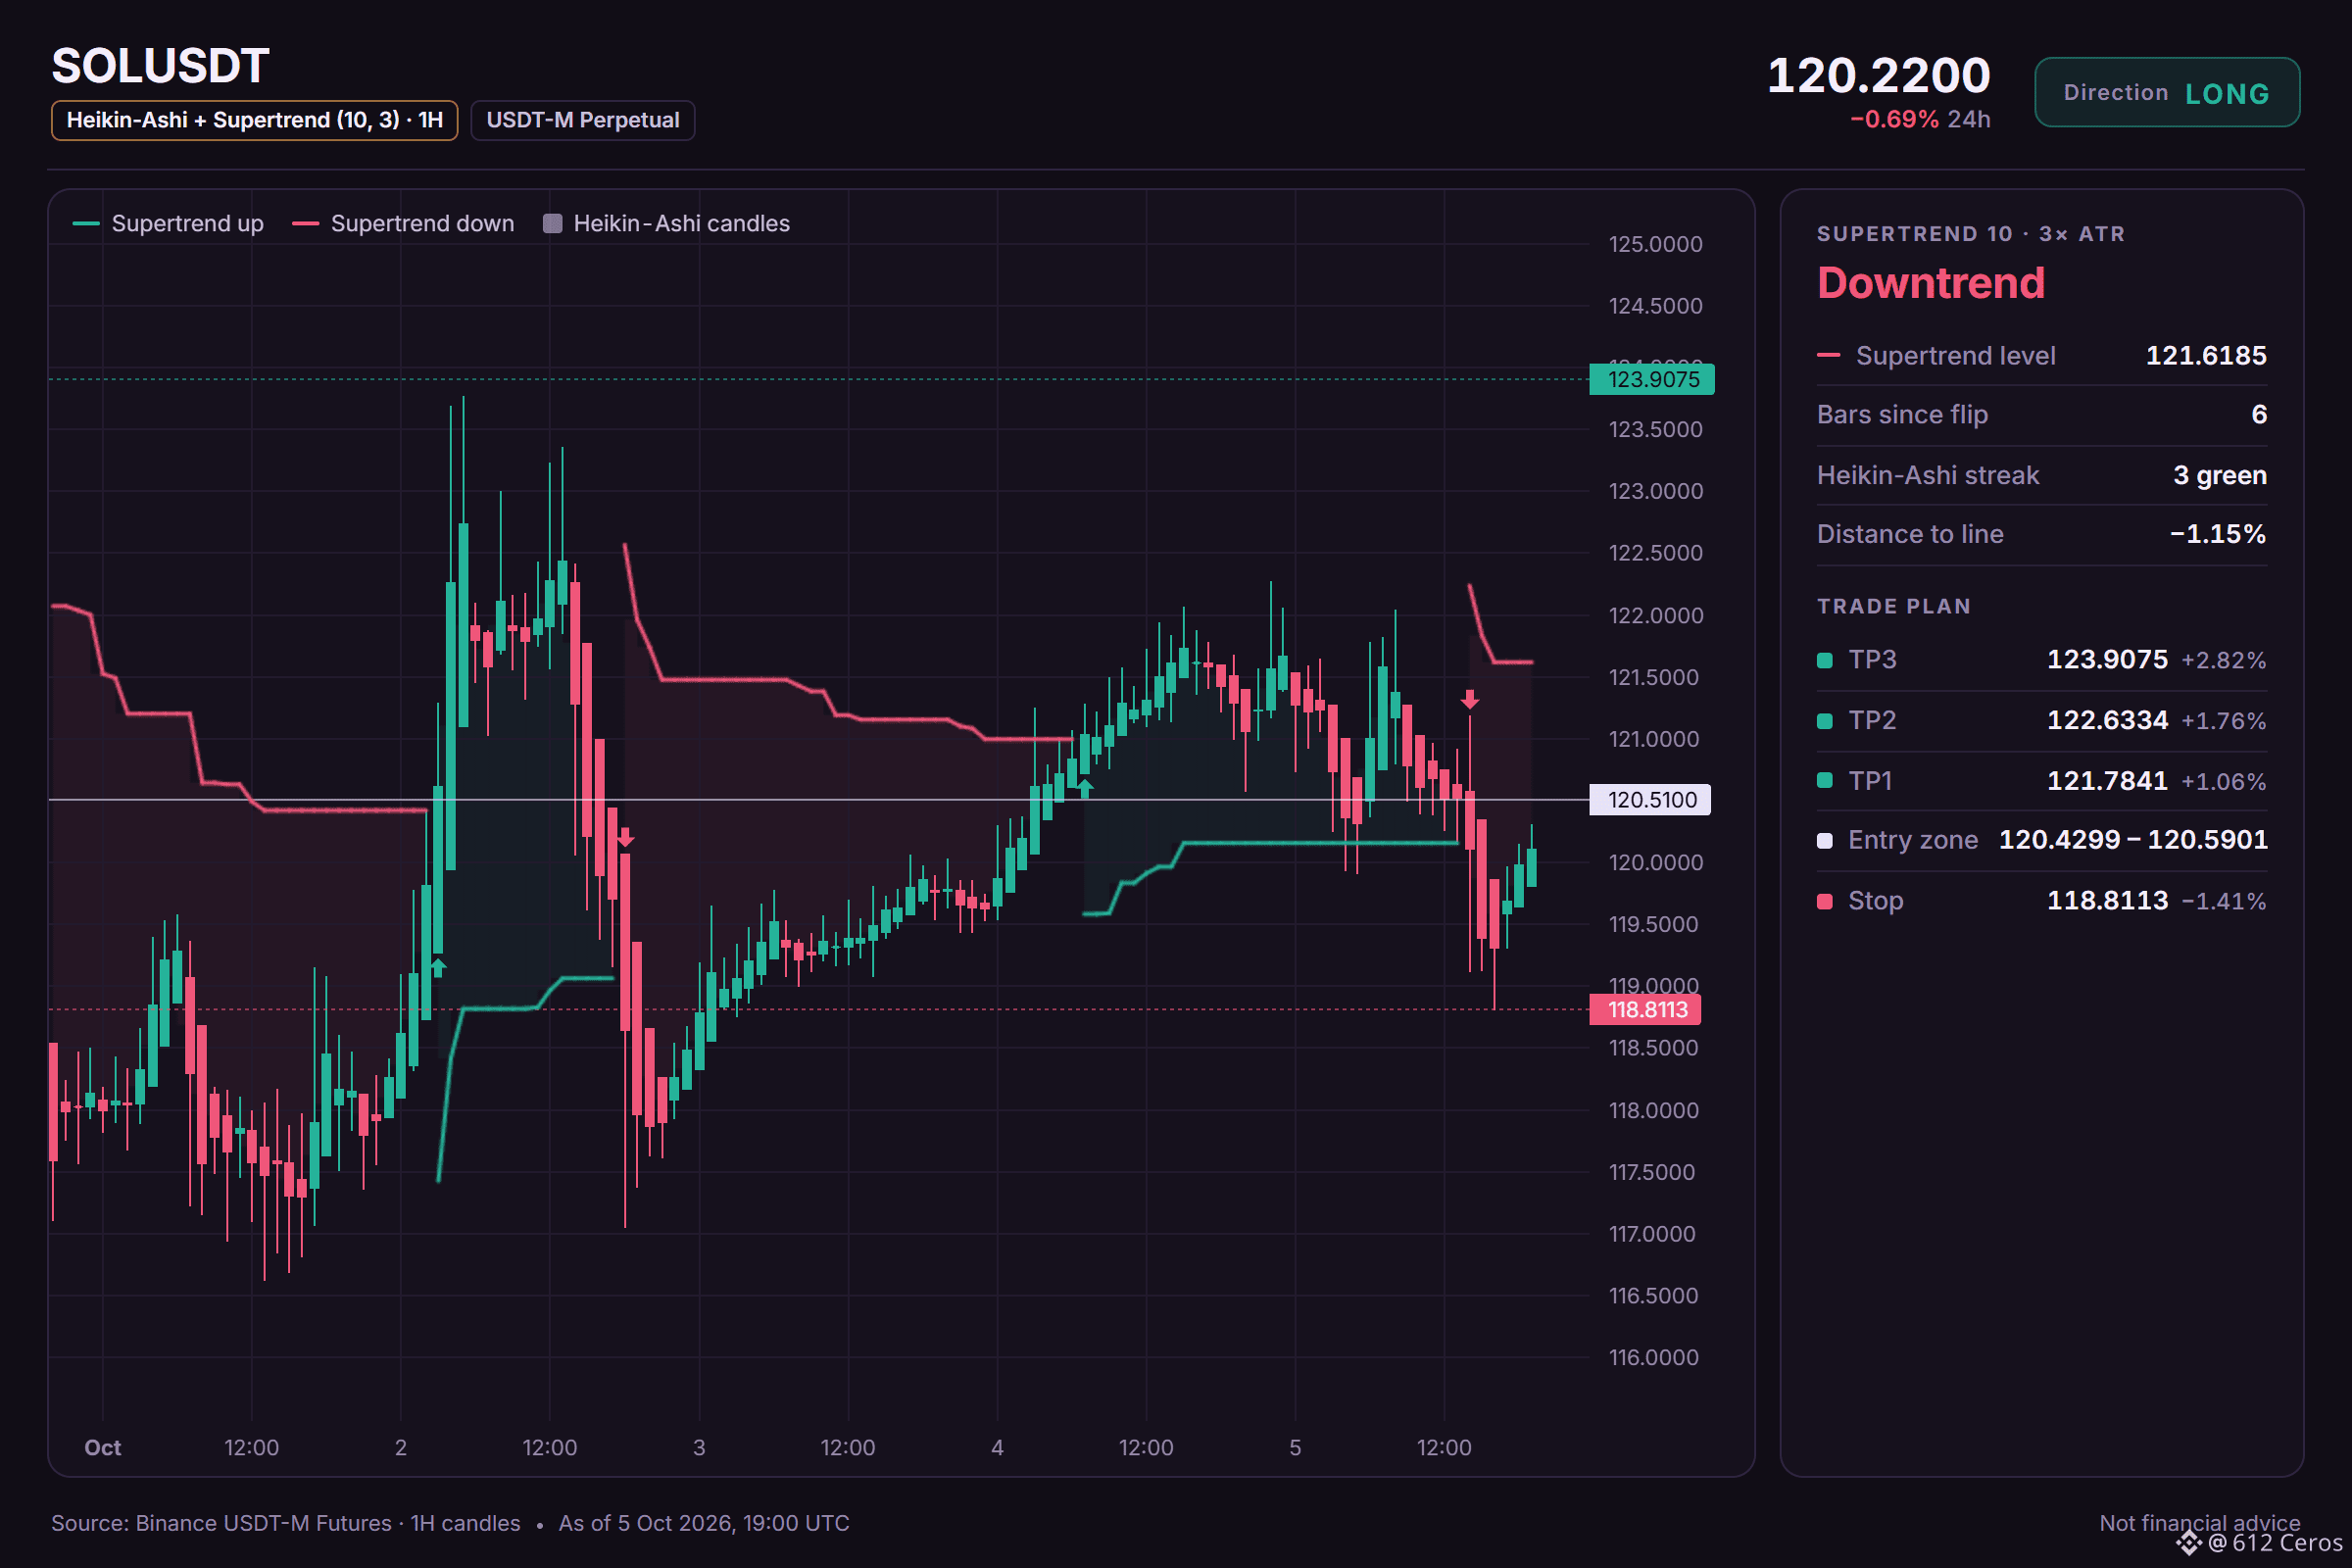
Entry: 120.4299 – 120.5901
TP1: 121.7841 (+1.1%)
TP2: 122.6334 (+1.8%)
TP3: 123.9075 (+2.8%)
SL: 118.8113 (-1.4%)
Plan: enter only inside the zone, take half at TP1, then move the stop to entry.
Note: moderate conviction only, keep size light.
Why LONG? Leaning call, 4/12 signals agree, 1 against, 7 undecided.
• Daily trend: price > EMA50 > EMA200, bullish stack → the big-picture trend is up
• 4h trend: price > EMA50 > EMA200, bullish stack → the swing trend is up
• 1h trend: price > EMA50 > EMA200, bullish stack → the short-term trend is up
Risk: RSI extreme in a range: RSI z-score +2.17 in a range, fade-the-high risk → top of a range, sellers often step in
Quick SOL read:
1. Daily trend is bullish with price above both EMAs, a bullish stack on the daily chart.
2. Short-term momentum is pushing buyers right now with the 15m RSI showing strong buying pressure.
3. This idea fails if price breaks below the daily structure, invalidating the bullish trend.
Where would you place your invalidation level on this setup?
Levels mapped on the chart below.
📲 Want more of my latest signals? Join me here:
https://app.binance.com/uni-qr/D26WbL9t
⚠️ Personal market analysis only. NFA — manage risk and DYOR.
Educational content, not investment advice or a recommendation to buy, sell, deposit, or withdraw any asset. No paid promotion or referral/affiliate links.
🟢 LONG $SOL /USDT: expecting price to go UP
Bias: LONG · Leaning
Entry: 120.4299 – 120.5901
TP1: 121.7841 (+1.1%)
TP2: 122.6334 (+1.8%)
TP3: 123.9075 (+2.8%)
SL: 118.8113 (-1.4%)
Plan: enter only inside the zone, take half at TP1, then move the stop to entry.
Note: moderate conviction only, keep size light.
Why LONG? Leaning call, 4/12 signals agree, 1 against, 7 undecided.
• Daily trend: price > EMA50 > EMA200, bullish stack → the big-picture trend is up
• 4h trend: price > EMA50 > EMA200, bullish stack → the swing trend is up
• 1h trend: price > EMA50 > EMA200, bullish stack → the short-term trend is up
Risk: RSI extreme in a range: RSI z-score +2.17 in a range, fade-the-high risk → top of a range, sellers often step in
Quick SOL read:
1. Daily trend is bullish with price above both EMAs, a bullish stack on the daily chart.
2. Short-term momentum is pushing buyers right now with the 15m RSI showing strong buying pressure.
3. This idea fails if price breaks below the daily structure, invalidating the bullish trend.
Where would you place your invalidation level on this setup?
Levels mapped on the chart below.
📲 Want more of my latest signals? Join me here:
https://app.binance.com/uni-qr/D26WbL9t
⚠️ Personal market analysis only. NFA — manage risk and DYOR.
Educational content, not investment advice or a recommendation to buy, sell, deposit, or withdraw any asset. No paid promotion or referral/affiliate links.