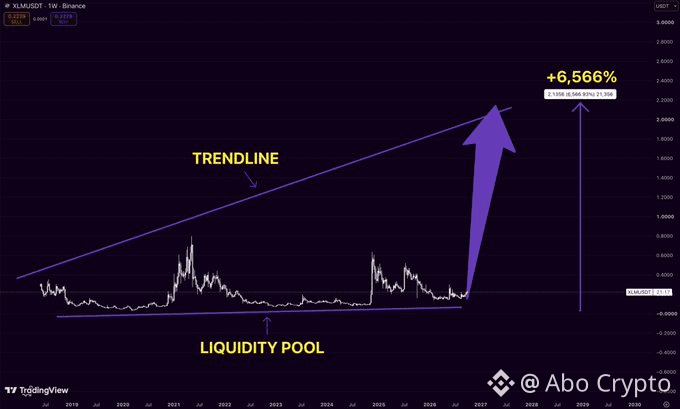
$XLM is one of those charts people ignore for years…
and then suddenly ask why they didn’t buy it earlier.
Look at the structure.
Years of accumulation near the same liquidity zone
while the macro trendline keeps pushing higher.
If $XLM finally leaves this range, I’m watching the $2+ area.
That would be roughly +6,500% from the bottom.
Sounds insane?
Good. The best charts usually do before they move
and then suddenly ask why they didn’t buy it earlier.
Look at the structure.
Years of accumulation near the same liquidity zone
while the macro trendline keeps pushing higher.
If $XLM finally leaves this range, I’m watching the $2+ area.
That would be roughly +6,500% from the bottom.
Sounds insane?
Good. The best charts usually do before they move