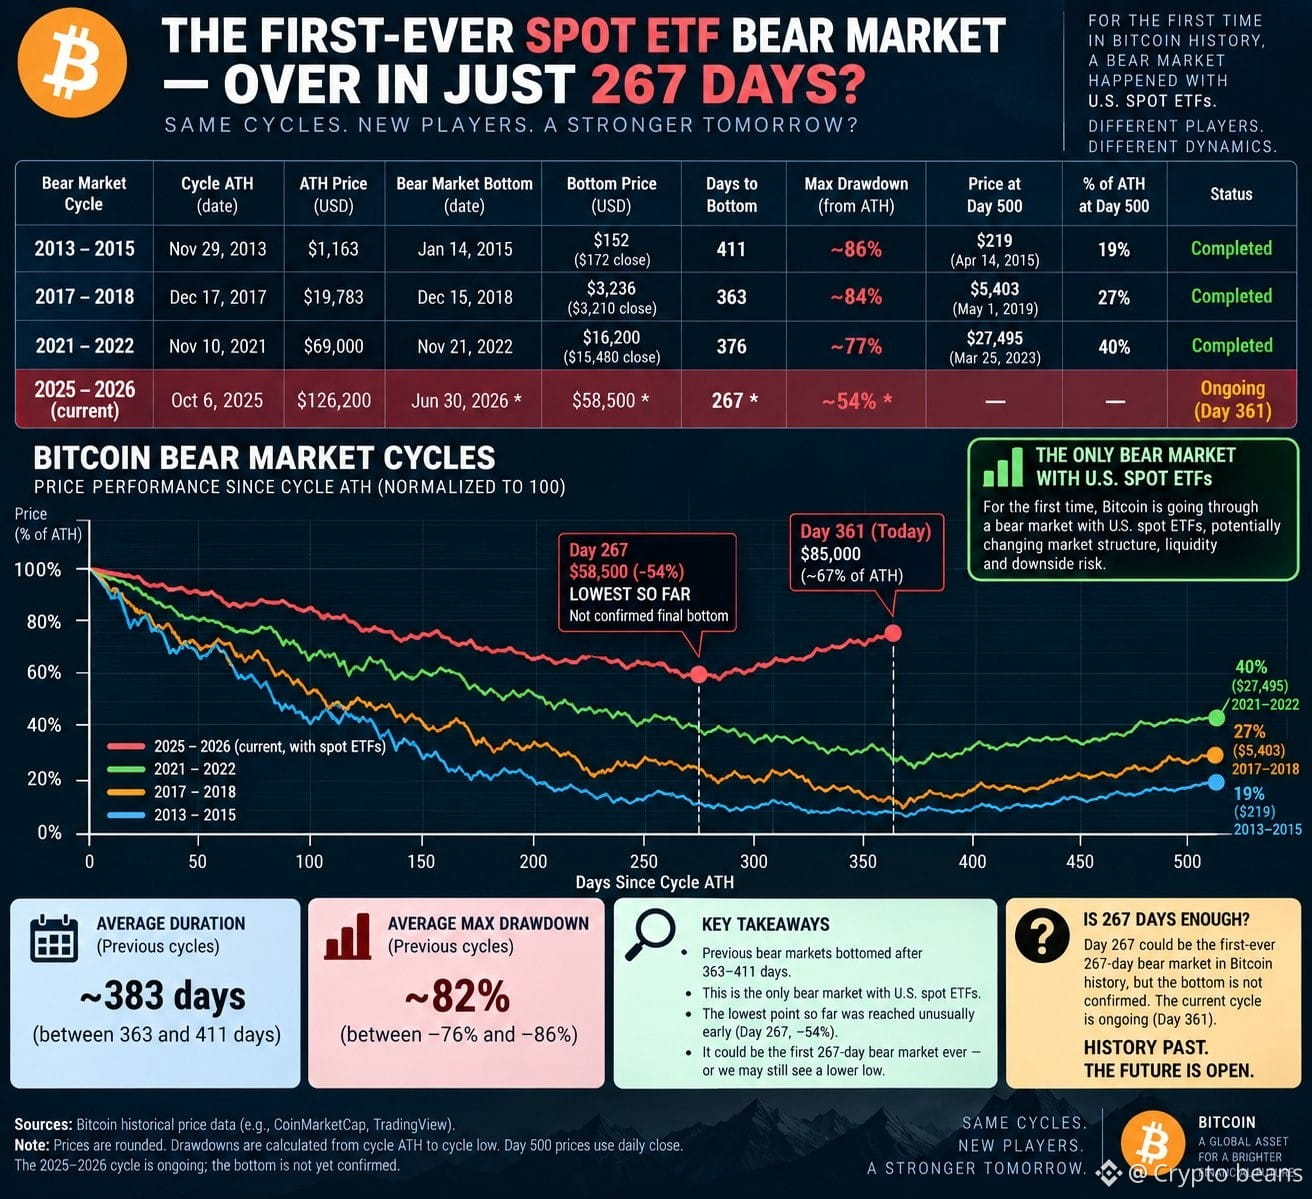
This chart completely changed how I’m looking at the current Bitcoin cycle😁
We all know Bitcoin bear markets are brutal.
Historically, they drag on for over a year, with drawdowns of 80%+.
But look at the red line on this chart. This cycle is acting completely different.
Because of the U.S. Spot ETFs, the market structure has fundamentally changed.
We hit a low of around $58.5k at Day 267—a relatively mild -54% drawdown—and we haven't broken that floor in the 94 days since.
Right now, we are sitting around Day 361 at ~$85k. If this pattern holds, it means the "267-day bear market" could be the shortest in history.
$BTC
We all know Bitcoin bear markets are brutal.
Historically, they drag on for over a year, with drawdowns of 80%+.
But look at the red line on this chart. This cycle is acting completely different.
Because of the U.S. Spot ETFs, the market structure has fundamentally changed.
We hit a low of around $58.5k at Day 267—a relatively mild -54% drawdown—and we haven't broken that floor in the 94 days since.
Right now, we are sitting around Day 361 at ~$85k. If this pattern holds, it means the "267-day bear market" could be the shortest in history.
$BTC