BITCOIN #BTC☀ on the 1st 'Relief Zone' of the Bull Cycle.
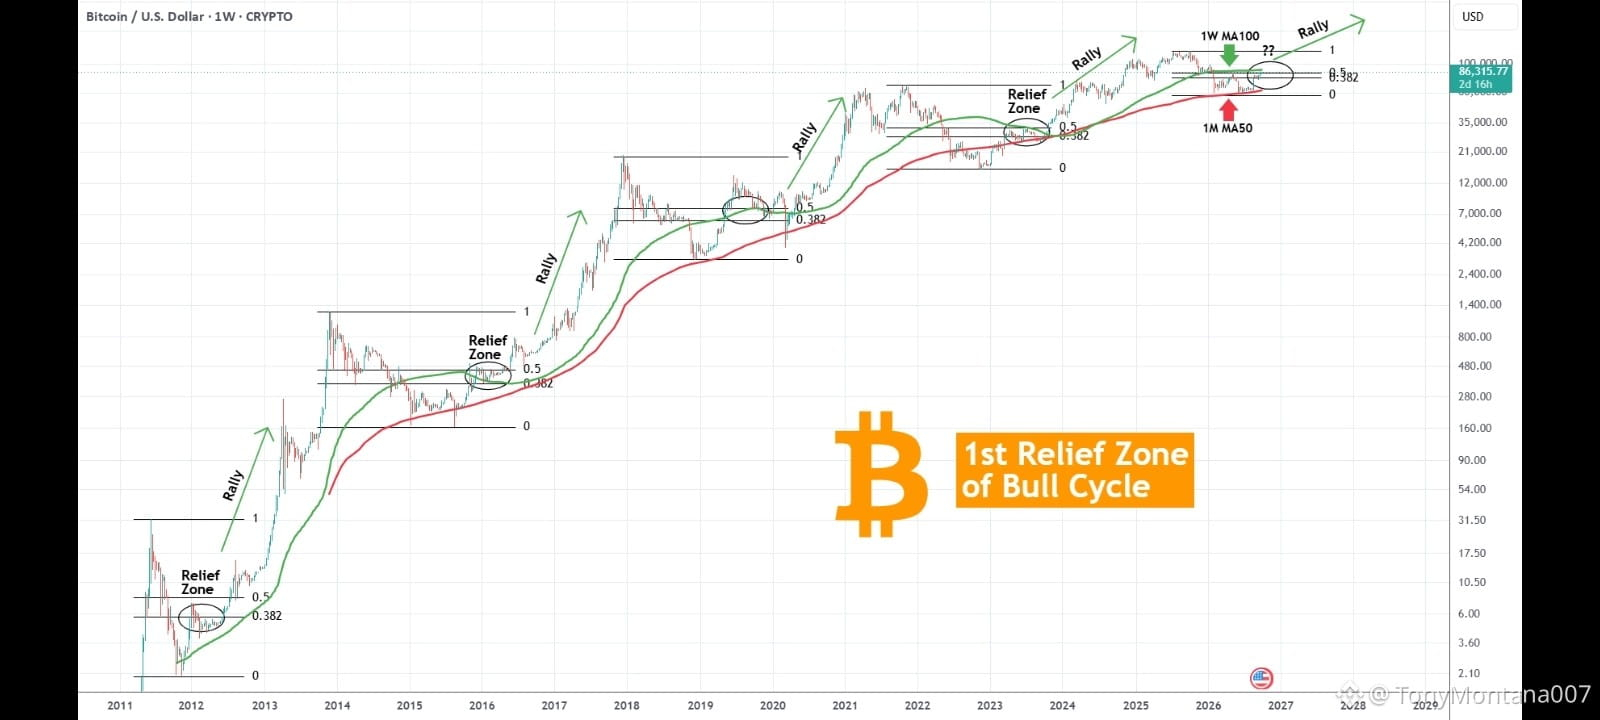
Bitcoin (BTCUSD) is approaching the 1W MA100 (green trend-line), which is technically a strong pressure level as it was the one that provided the first Support of the Bear Cycle during November 2025 -January 2026, before it eventually broke. At the same time, it has just reached the 0.5 Fibonacci retracement level of the Cycle.
Historically, during every Bull Cycle except for 2019, BTC pulled back to or below the 0.382 Fib when it reached the 1W MA100 - 0.5 Fib Zone. We technically call this the '1st Relief Zone' of the Bull Cycle.
Of course every time has a variation. In 2023 the rejection did happen on both the 1W MA100 and 0.5 Fib, and the price pulled back below the 0.382 Fib and marginally the 1M MA50 (red trend-line), which on the current Cycle is where the bottom was formed. In 2019 the Facebook Libra euphoria stormed past that Resistance and there was no Relief Zone but later in the year it did approach the 0.382 Fib and with the March 2020 COVID crash (Black Swan event) it even broke below the 1M MA50. IN 2015-2016 was another textbook implementation of the Relief Zone, respecting both the 0.5 and 0.382 Fibs. Even the earliest Cycle in 2012, it formed aRelief Zone, pulling back just before a 0.5 test and as a consequence considerably below the 0.382 Fib (but of course volumes and caps were too low then).
As a result, we may see a Relief pull-back here and 0.5 -0.382 ranged trading for some time, especially with the U.S. Midterm Elections just 1 month away, but of course we shouldn't discount the possibility of another major euphoria event like 2019 Libra to storm past it. But even that has proved that the Bull Cycle will always offer corrections for 'dip-buying' opportunities, which should be taken advantage of. Time remains on the investor's side.
So do you think we will be entering a Relief Zone again? Feel free to let us know in the comments section below!
Please LIKE, FOLLOW SHARE and COMMENT if you enjoy this idea! Also share your ideas and charts in the comments section below!
Bitcoin (BTCUSD) is approaching the 1W MA100 (green trend-line), which is technically a strong pressure level as it was the one that provided the first Support of the Bear Cycle during November 2025 -January 2026, before it eventually broke. At the same time, it has just reached the 0.5 Fibonacci retracement level of the Cycle.
Historically, during every Bull Cycle except for 2019, BTC pulled back to or below the 0.382 Fib when it reached the 1W MA100 - 0.5 Fib Zone. We technically call this the '1st Relief Zone' of the Bull Cycle.
Of course every time has a variation. In 2023 the rejection did happen on both the 1W MA100 and 0.5 Fib, and the price pulled back below the 0.382 Fib and marginally the 1M MA50 (red trend-line), which on the current Cycle is where the bottom was formed. In 2019 the Facebook Libra euphoria stormed past that Resistance and there was no Relief Zone but later in the year it did approach the 0.382 Fib and with the March 2020 COVID crash (Black Swan event) it even broke below the 1M MA50. IN 2015-2016 was another textbook implementation of the Relief Zone, respecting both the 0.5 and 0.382 Fibs. Even the earliest Cycle in 2012, it formed aRelief Zone, pulling back just before a 0.5 test and as a consequence considerably below the 0.382 Fib (but of course volumes and caps were too low then).
As a result, we may see a Relief pull-back here and 0.5 -0.382 ranged trading for some time, especially with the U.S. Midterm Elections just 1 month away, but of course we shouldn't discount the possibility of another major euphoria event like 2019 Libra to storm past it. But even that has proved that the Bull Cycle will always offer corrections for 'dip-buying' opportunities, which should be taken advantage of. Time remains on the investor's side.
So do you think we will be entering a Relief Zone again? Feel free to let us know in the comments section below!
Please LIKE, FOLLOW SHARE and COMMENT if you enjoy this idea! Also share your ideas and charts in the comments section below!