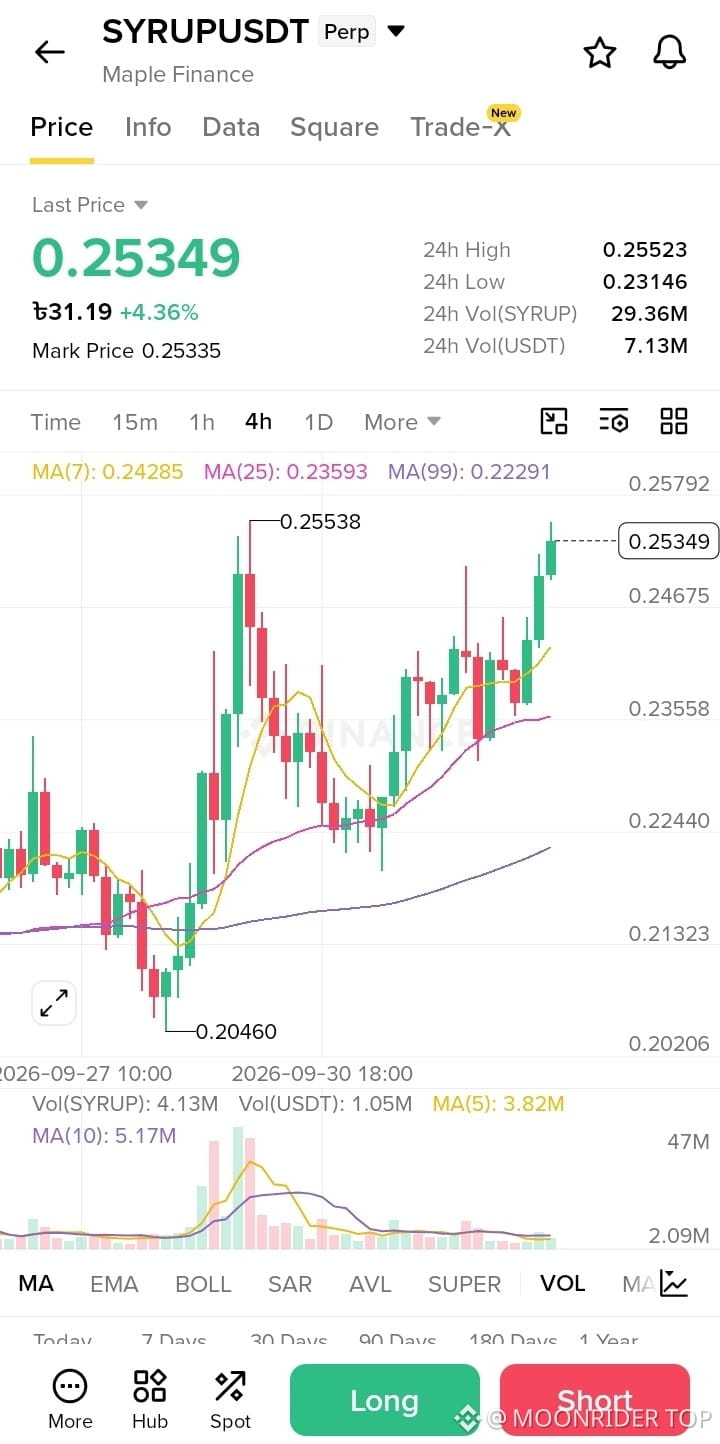
Everyone is waiting for a breakout—I am watching $SYRUP / USDT completing a textbook chart setup on the 4h timeframe, signaling a massive shift in short-term momentum.
LONG (4h Reversal Setup)
Trade Plan:
* Entry Zone: 0.2420 – 0.2535
* SL: 0.2030
* TP1: 0.2554
* TP2: 0.2750
* TP3: 0.2980
* TP4: 0.3250
Why this setup?
According to the 4h chart, $SYRUP is trading with strong bullish momentum following a successful test of structural support near 0.20460, driving a clean move away from local lows with a +4.36% gain. The price action has pushed aggressively above the dynamic moving average lines, including the MA7 (0.24285) and MA25 (0.23593), flipping them into solid support. With a notable volume presence (7.13M USDT volume), this impulse wave is primed to challenge the 24h high of 0.25538 and expand toward higher overhead resistance zones.
Debate:
What do you think? Will SYRUP aggressively break through the 24h high at 0.25538, or will we see a slight retest of the lower support lines before the secondary expansion? Drop your analysis below!$SYRUP
LONG (4h Reversal Setup)
Trade Plan:
* Entry Zone: 0.2420 – 0.2535
* SL: 0.2030
* TP1: 0.2554
* TP2: 0.2750
* TP3: 0.2980
* TP4: 0.3250
Why this setup?
According to the 4h chart, $SYRUP is trading with strong bullish momentum following a successful test of structural support near 0.20460, driving a clean move away from local lows with a +4.36% gain. The price action has pushed aggressively above the dynamic moving average lines, including the MA7 (0.24285) and MA25 (0.23593), flipping them into solid support. With a notable volume presence (7.13M USDT volume), this impulse wave is primed to challenge the 24h high of 0.25538 and expand toward higher overhead resistance zones.
Debate:
What do you think? Will SYRUP aggressively break through the 24h high at 0.25538, or will we see a slight retest of the lower support lines before the secondary expansion? Drop your analysis below!$SYRUP