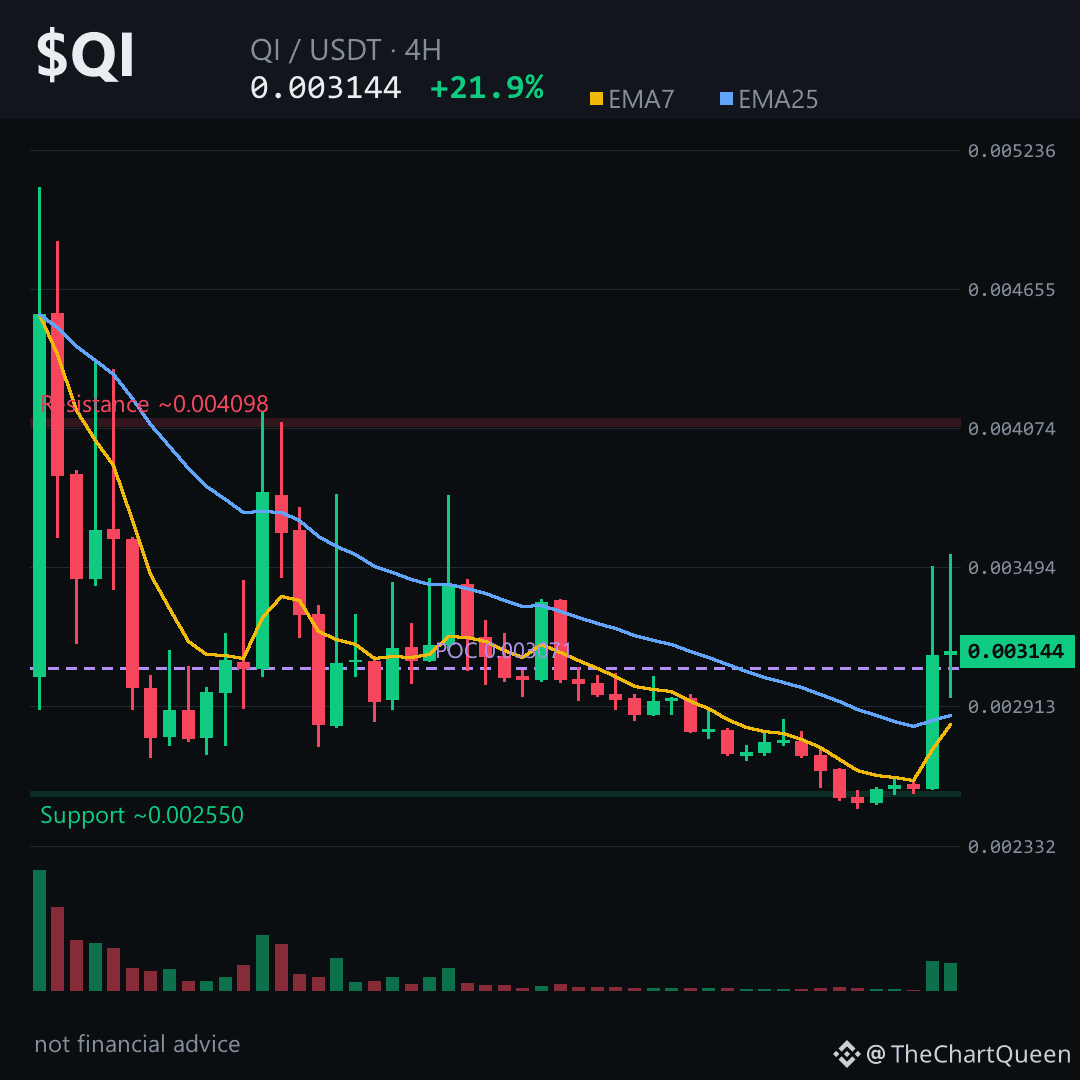
A 21% candle in four hours doesn't whisper opportunity. It screams distribution until proven otherwise.
The daily chart says one thing. The 4H says another. That conflict is exactly where accounts get chewed up.
$QI ripped from 0.00257 to 0.00355 in one 4H candle, then gave half back over the next eight hours. That's not accumulation — that's a liquidity event.
The 4H is the only timeframe worth reading right now. Daily is technically bullish, but 4H shows exhaustion. Price sits near 0.00317, pinned below the 4H EMA25, with RSI fading from overbought. Volume profile's point of control is 0.00307 — a magnet, not a springboard.
Worse, the move left no unfilled gap on the 4H. No structural demand behind it. No obvious floor until 0.00290.
My levels on $QI: if 0.00335 holds as resistance on any retest, the path of least resistance is a fade toward 0.00290. Lose that zone on a 4H close and the entire pump gets retraced. The bullish case only survives above 0.00335 — and right now the candles aren't showing that conviction.
Tap $QI to pull up the chart and check the 4H volume on that spike. You'll see what I mean.
Follow me — I'll update this read if the 4H structure shifts.
What level are you watching on QI — the 0.00290 floor or the 0.00335 ceiling? 👇
⚠️ Not financial advice. DYOR.
#QI #Crypto #BinanceSquare
The daily chart says one thing. The 4H says another. That conflict is exactly where accounts get chewed up.
$QI ripped from 0.00257 to 0.00355 in one 4H candle, then gave half back over the next eight hours. That's not accumulation — that's a liquidity event.
The 4H is the only timeframe worth reading right now. Daily is technically bullish, but 4H shows exhaustion. Price sits near 0.00317, pinned below the 4H EMA25, with RSI fading from overbought. Volume profile's point of control is 0.00307 — a magnet, not a springboard.
Worse, the move left no unfilled gap on the 4H. No structural demand behind it. No obvious floor until 0.00290.
My levels on $QI: if 0.00335 holds as resistance on any retest, the path of least resistance is a fade toward 0.00290. Lose that zone on a 4H close and the entire pump gets retraced. The bullish case only survives above 0.00335 — and right now the candles aren't showing that conviction.
Tap $QI to pull up the chart and check the 4H volume on that spike. You'll see what I mean.
Follow me — I'll update this read if the 4H structure shifts.
What level are you watching on QI — the 0.00290 floor or the 0.00335 ceiling? 👇
⚠️ Not financial advice. DYOR.
#QI #Crypto #BinanceSquare