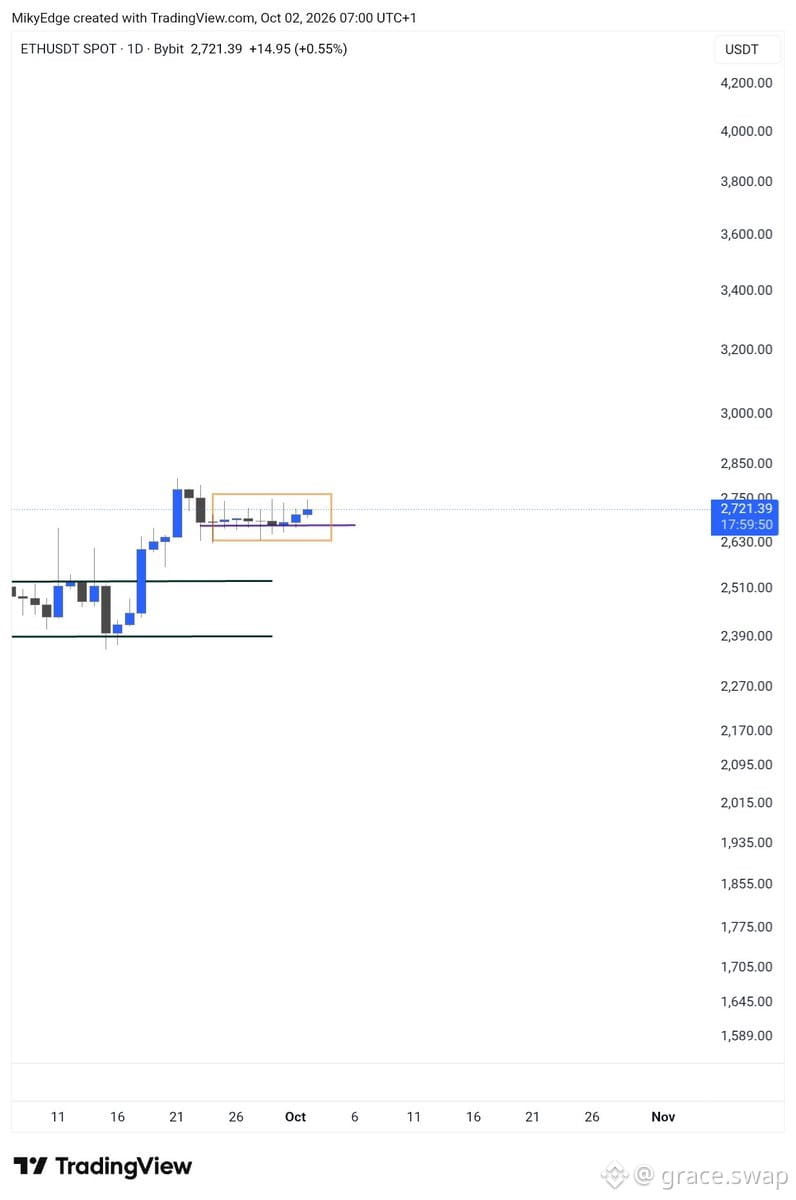
$ETH daily chart looking like a textbook bull flag setup
We've all seen this movie before - tight consolidation after a strong move up, volume drying up, coiling for the next leg
The pattern is screaming continuation but market needs to hold support here
If this breaks up with volume, we're looking at a measured move that could send $ETH significantly higher
But if support fails, this whole setup invalidates fast
Chart setups only work when the macro cooperates - watch $BTC dominance and overall market liquidity
We've all seen this movie before - tight consolidation after a strong move up, volume drying up, coiling for the next leg
The pattern is screaming continuation but market needs to hold support here
If this breaks up with volume, we're looking at a measured move that could send $ETH significantly higher
But if support fails, this whole setup invalidates fast
Chart setups only work when the macro cooperates - watch $BTC dominance and overall market liquidity