$FET Spikes to Fresh Highs Then Fades Momentum Stalling at Resistance
Pair: $FET /USDT
Direction: SHORT
Leverage: 5x
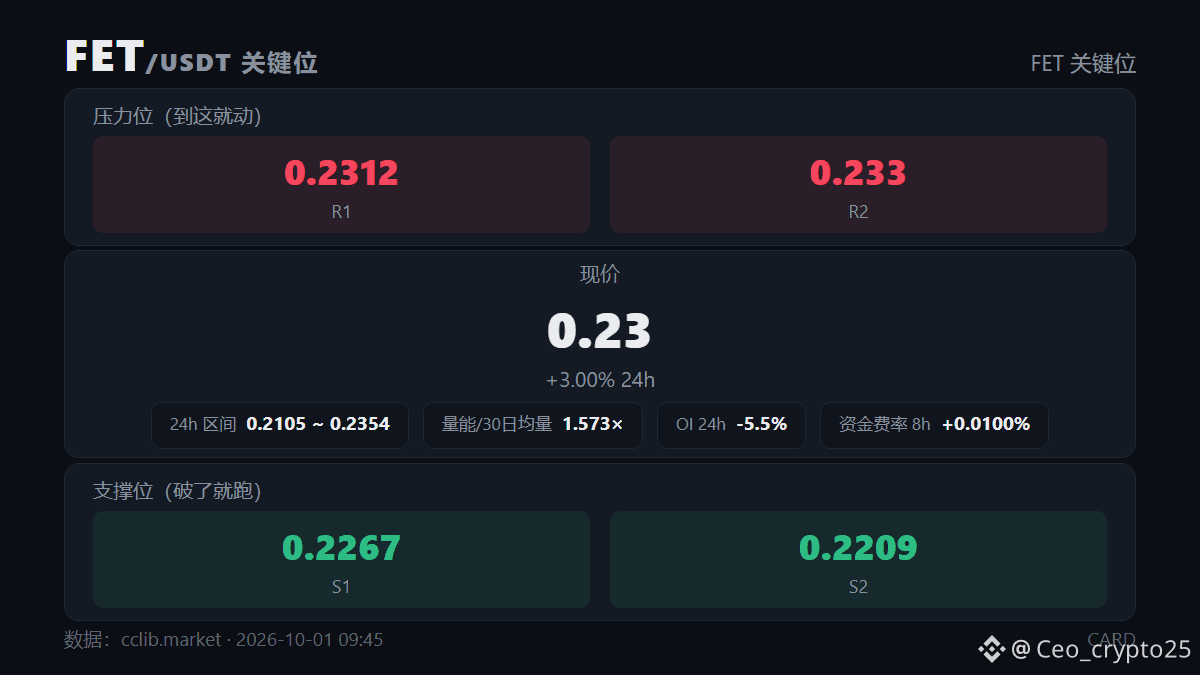
Entry Zone: 0.2310 – 0.2330
Take Profit:
- TP1: 0.2260 +11%
- TP2: 0.2220 +19%
- TP3: 0.2180 +28%
Stop Loss: 0.2420
Chart Structure:
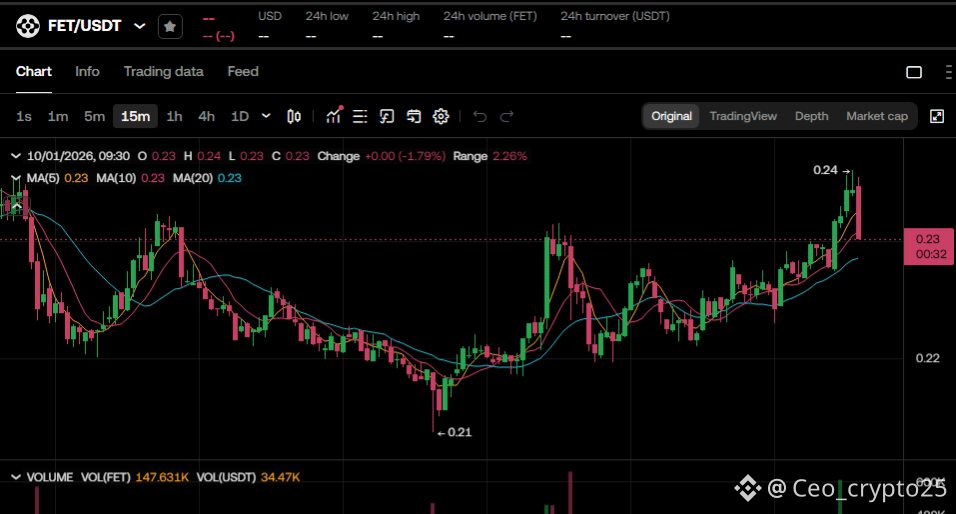
- FET bottomed near 0.21 and rallied sharply off that low, with the final leg producing a fresh high at 0.24 before a clear red rejection candle pulled price back toward 0.23
- All three moving averages (MA5, MA10, MA20) are stacked bullish and supported the rally, but the sharp reversal candle at the top shows buyers losing control at resistance
- The rejection came on volume comparable to the breakout spike, suggesting genuine profit-taking rather than a minor pullback
- No basing has occurred yet after the spike, so this is an early fade of the move rather than a confirmed trend reversal treat it as tactical
- Stop placed above the recent 0.24 high, which would need to be reclaimed to invalidate the fade
$FET
Pair: $FET /USDT
Direction: SHORT
Leverage: 5x
Entry Zone: 0.2310 – 0.2330
Take Profit:
- TP1: 0.2260 +11%
- TP2: 0.2220 +19%
- TP3: 0.2180 +28%
Stop Loss: 0.2420
Chart Structure:
- FET bottomed near 0.21 and rallied sharply off that low, with the final leg producing a fresh high at 0.24 before a clear red rejection candle pulled price back toward 0.23
- All three moving averages (MA5, MA10, MA20) are stacked bullish and supported the rally, but the sharp reversal candle at the top shows buyers losing control at resistance
- The rejection came on volume comparable to the breakout spike, suggesting genuine profit-taking rather than a minor pullback
- No basing has occurred yet after the spike, so this is an early fade of the move rather than a confirmed trend reversal treat it as tactical
- Stop placed above the recent 0.24 high, which would need to be reclaimed to invalidate the fade
$FET