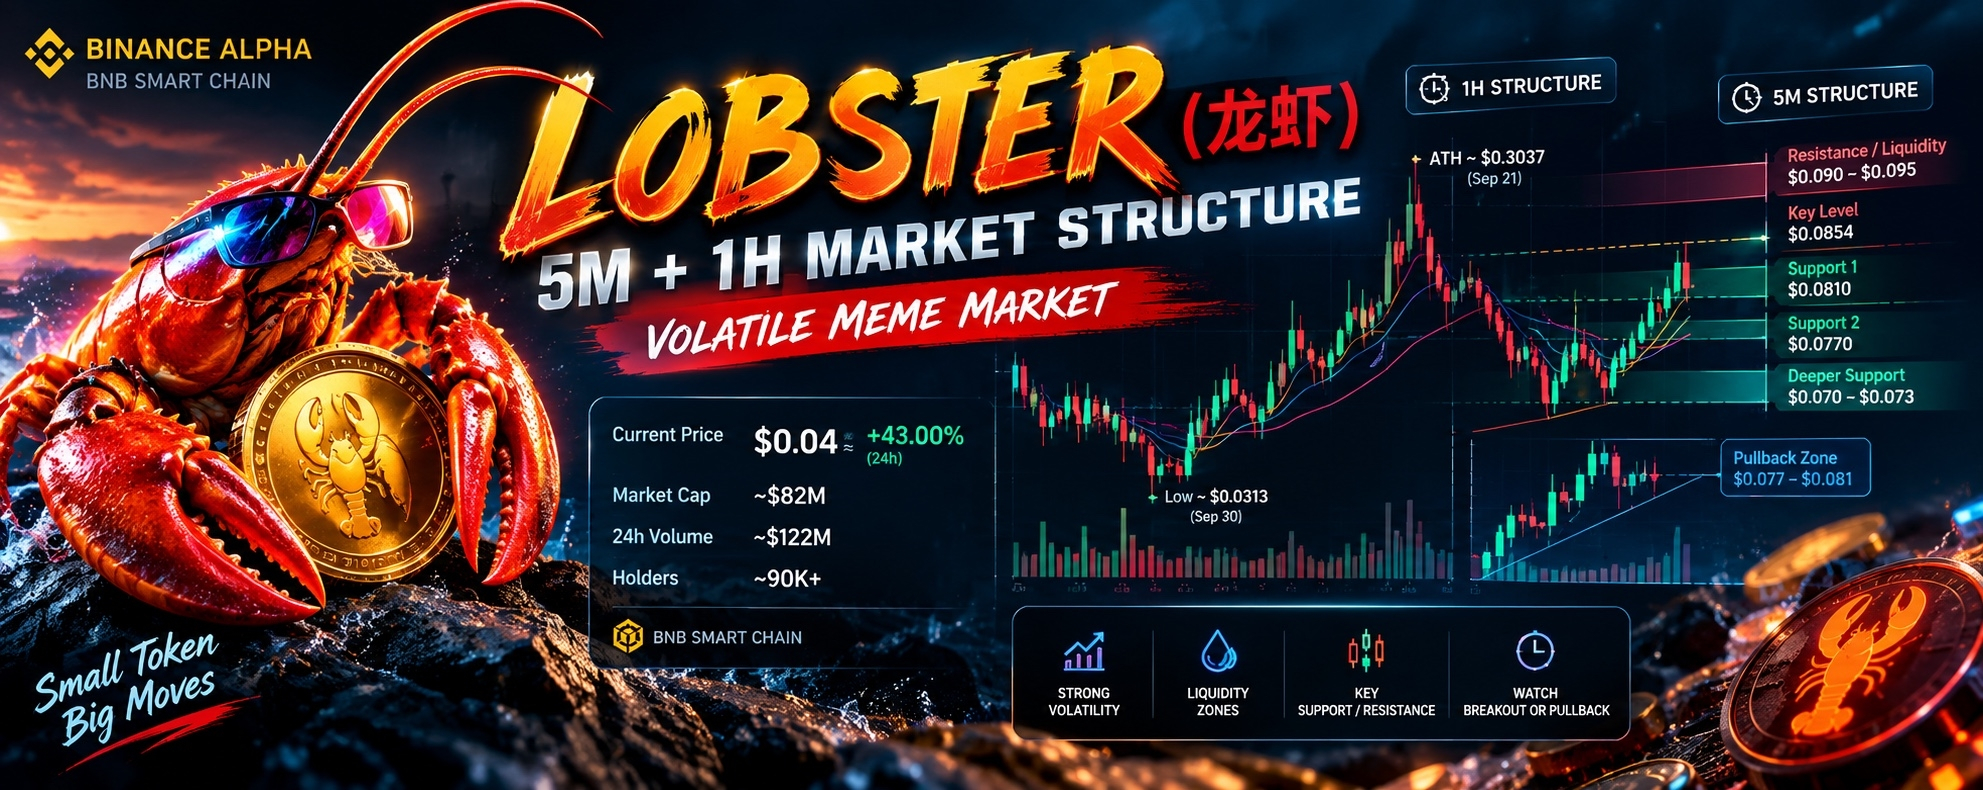

🦞 龙虾 (Lobster): 5M + 1H Technical Analysis After the Sharp Pump
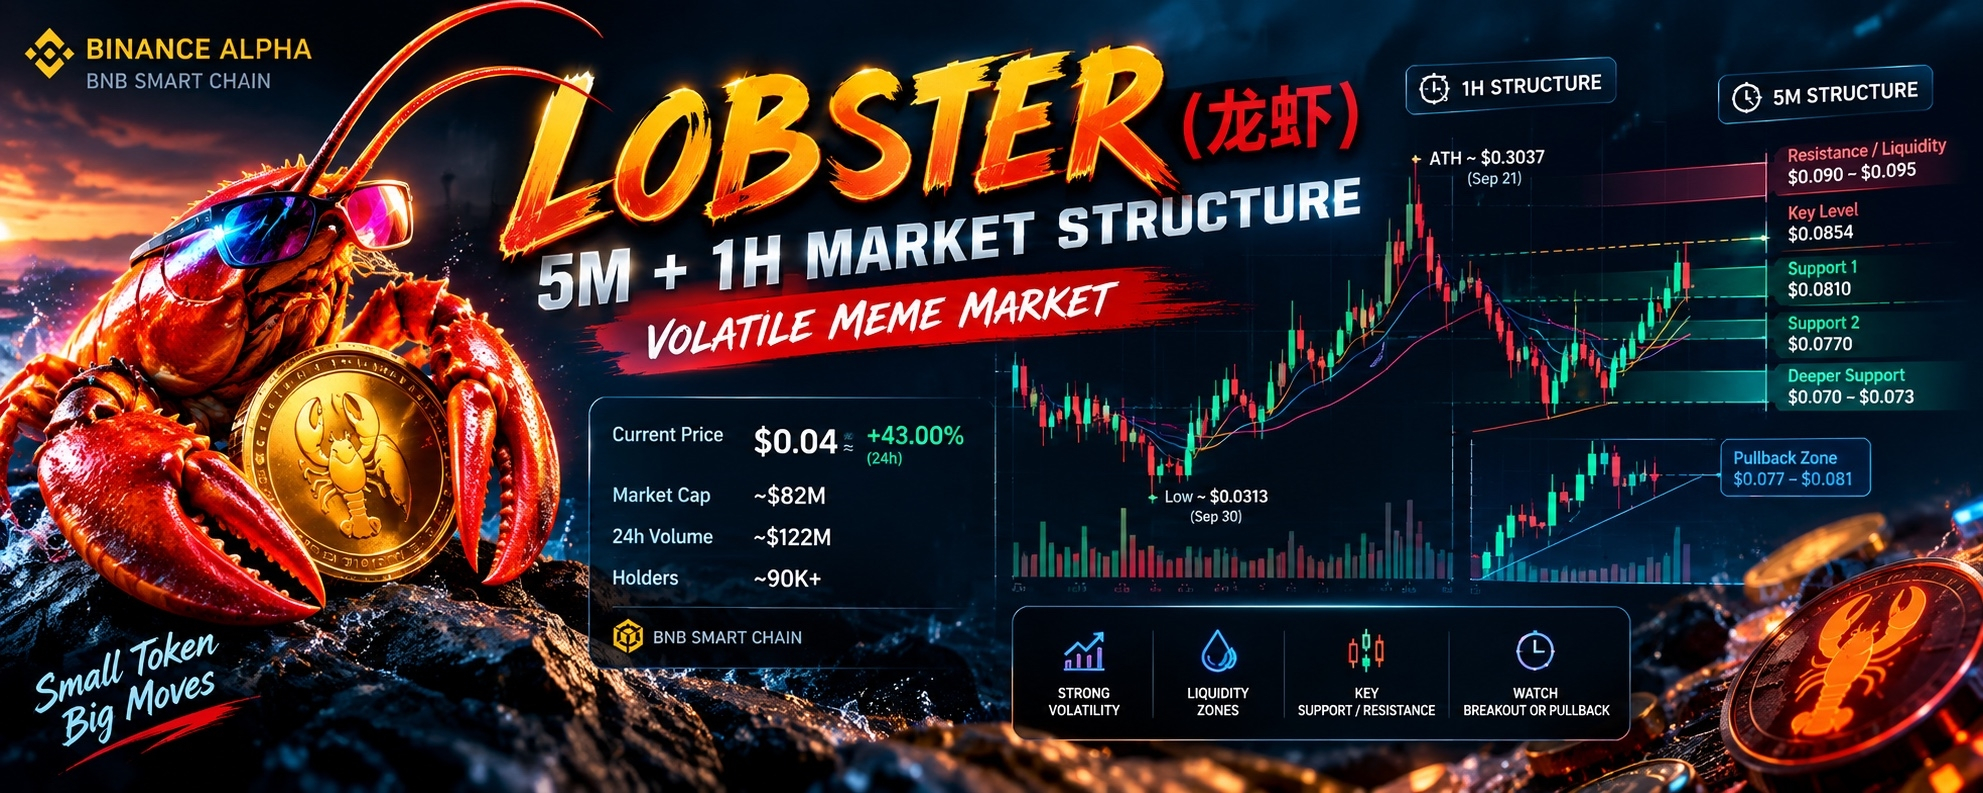
October 1, 2026 | Crypto Market Analysis
龙虾 (Lobster) has become one of the most volatile Binance Alpha tokens, with price action showing a sharp rebound after a major September sell-off. Binance has confirmed 龙虾 as a Binance Alpha token on BNB Smart Chain, while emphasizing that Alpha inclusion does not guarantee a future Binance Spot listing.
At the time of this analysis, CoinMarketCap showed 龙虾 around $0.082, with approximately $122 million in 24-hour volume, a market capitalization near $82 million, and a 24-hour gain of roughly 43%.
🚀 Why Has 龙虾 Pumped?
The recent move needs to be viewed in the context of an extremely volatile market structure.
Historical data shows that 龙虾 fell from approximately $0.24 on September 21 to $0.0355 on September 30. The September 30 low was approximately $0.0313.
The sharp recovery from that low has therefore produced a very large percentage gain in a short period.
Several factors can contribute to this type of move:
Binance Alpha visibility
Meme-token speculation
Increased trading volume
Momentum traders entering after a breakout
Short-term liquidity being concentrated around previous highs and lows
Recovery from an extremely oversold level
However, the magnitude of the move also means volatility and reversal risk are exceptionally high.
📊 5-Minute Structure
Your 5M screenshot shows a clear bullish momentum structure.
The price was around $0.0847, while:
MA(7): $0.08105
MA(25): $0.07697
MA(99): $0.052997
Recent high: $0.085395
The moving averages are aligned:
MA7 > MA25 > MA99
This indicates strong short-term upward momentum.
The problem is that price is already close to the recent high.
Therefore, the market is currently at an important decision point:
Breakout or liquidity sweep?
💧 Liquidity Map
🔴 Buy-Side Liquidity
$0.0854–$0.0880
The recent $0.085395 high is the first obvious liquidity area.
If price moves above it with strong volume and holds the level, momentum could continue.
If price briefly breaks it and immediately falls back below, that could represent a liquidity sweep rather than a genuine breakout.
🟢 First Support
$0.0805–$0.0815
This area is close to the 5M MA7.
A pullback into this zone followed by a higher low would keep the short-term bullish structure intact.
🟢 Major Short-Term Support
$0.0765–$0.0780
This area is particularly important because it overlaps with the 5M MA25 around $0.07697.
A successful defense here would provide stronger evidence that buyers are still controlling the short-term structure.
🟡 Deeper Support
$0.070–$0.073
A move into this region would represent a deeper retracement and could become an important liquidity area.
🕐 1H Perspective
The higher-timeframe context is more complicated than the 5M chart.
The September data shows a huge expansion followed by an equally dramatic decline. 龙虾 reached an all-time high around $0.3037 on September 21, according to CoinMarketCap, before falling substantially.
That means the current move should be viewed as a recovery inside a highly volatile larger structure, rather than automatically assuming that the previous long-term uptrend has returned.
The 1H chart should therefore be watched for:
Higher High → Higher Low → Higher High
rather than simply relying on one large green candle.
📈 Bullish Scenario
A stronger bullish continuation would look like:
$0.0854 breakout → volume expansion → successful retest → higher low
Possible upside observation zones:
$0.090 → $0.095 → $0.100
These are technical observation levels, not guaranteed targets.
The most important confirmation is whether price can hold above the previous high after breaking it.
📉 Bearish / Reversal Scenario
A potential reversal structure would look like:
$0.0854 sweep → rejection → lower high → break below $0.081
If $0.081 fails, attention moves toward:
$0.077 → $0.073 → $0.070
A decisive break below approximately $0.077 would significantly weaken the current 5M bullish structure.
⚠️ Don’t Chase the Green Candle
One of the biggest risks here is buying simply because the token has risen more than 40%.
The historical data demonstrates how quickly this token can move in both directions. For example, the September 30 daily candle traded from approximately $0.0695 down to $0.0313 before closing around $0.0355.
That is an enormous intraday range.
So the better framework is:
Breakout + confirmation
or
Pullback + confirmation
rather than entering simply because momentum is strong.
🧠 龙虾 Trading Map
Level
Meaning
$0.090–0.095
Upper momentum area
$0.0854
Key breakout/liquidity level
$0.0810
First short-term support
$0.0770
Major 5M support / MA25
$0.070–0.073
Deeper support
Below $0.070
Short-term structure increasingly weak
🔥 Key Takeaway
龙虾 is currently showing strong 5M bullish momentum, but the price is also approaching a major liquidity area around $0.0854.
The critical question is not simply whether 龙虾 can rise further.
It is whether the market can break $0.0854, hold above it, and establish a new higher low.
For traders watching the setup, the two most important areas are:
$0.0854 → breakout confirmation
$0.081–$0.077 → pullback/support zone
Because this is a Binance Alpha/meme asset with extreme volatility, the analysis should be treated as a technical framework rather than a prediction. Binance itself describes Alpha as a platform for early-stage projects and notes that Alpha inclusion does not guarantee a future listing.
Not financial advice. High-risk asset. Use appropriate position sizing and consider slippage/liquidity before trading.