The daily trend is bullish on BTC.
🟢 LONG $BTC /USDT: expecting price to go UP
Bias: LONG · Strong
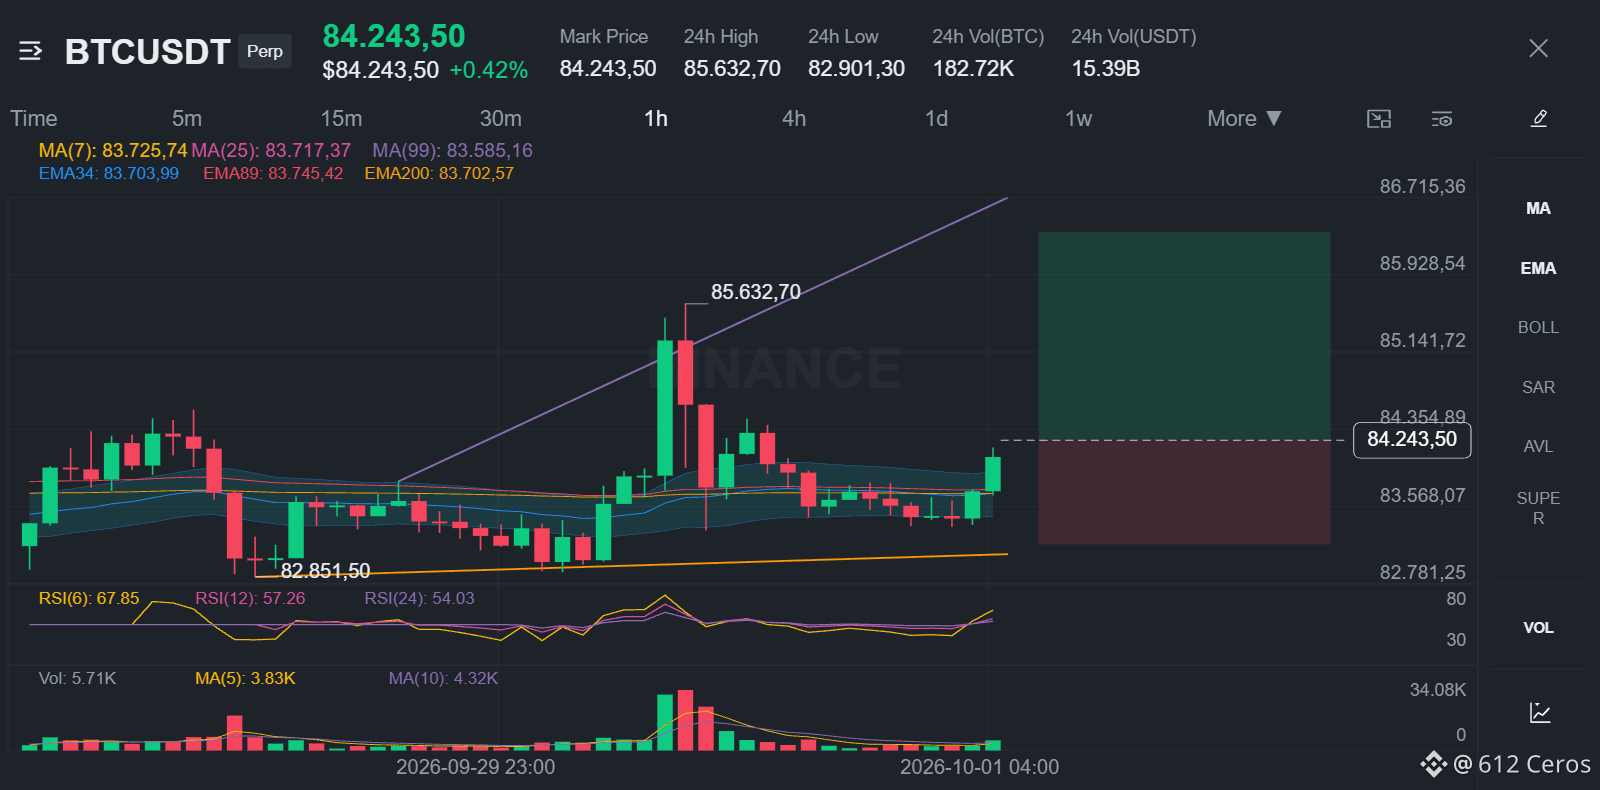
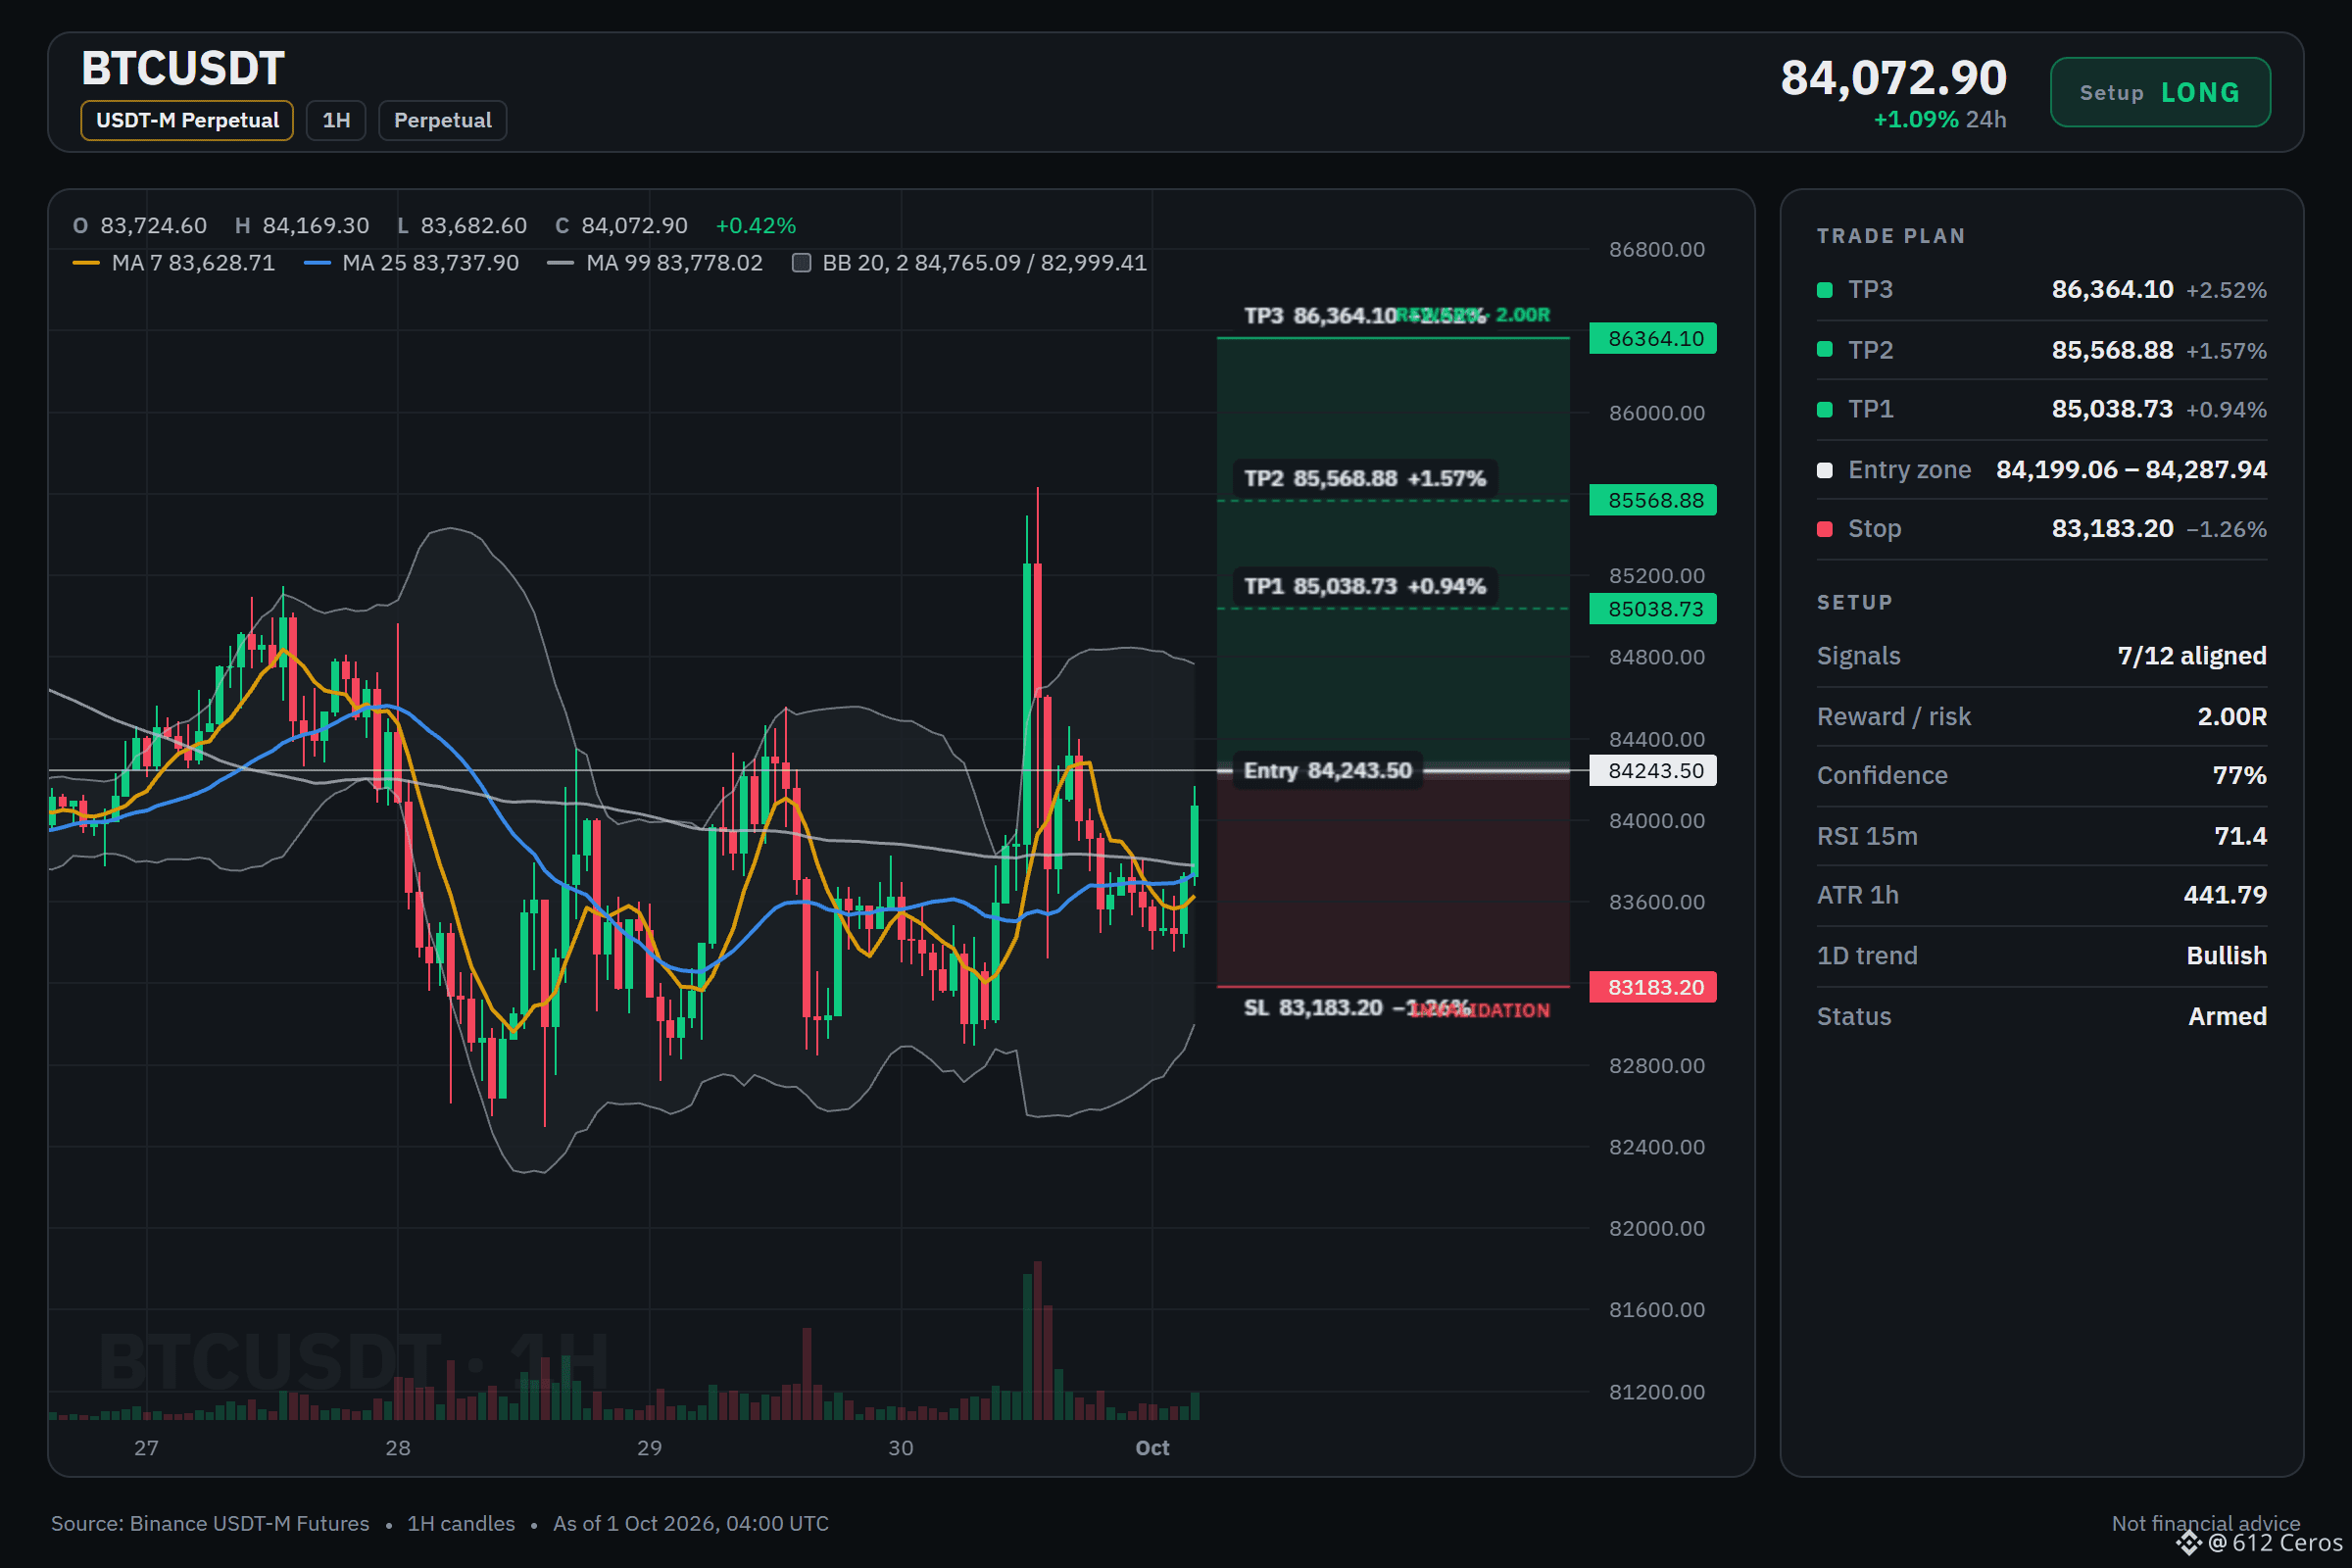
📍 Entry: 84199.06 – 84287.94
🎯 TP1: 85038.73 (+0.9%)
🎯 TP2: 85568.88 (+1.6%)
🎯 TP3: 86364.10 (+2.5%)
🛑 SL: 83183.20 (-1.3%)
💡 Enter only inside the zone. Take half at TP1, then move the stop to entry.
Why LONG? Strong call, 7/12 signals agree, 1 against, 4 undecided.
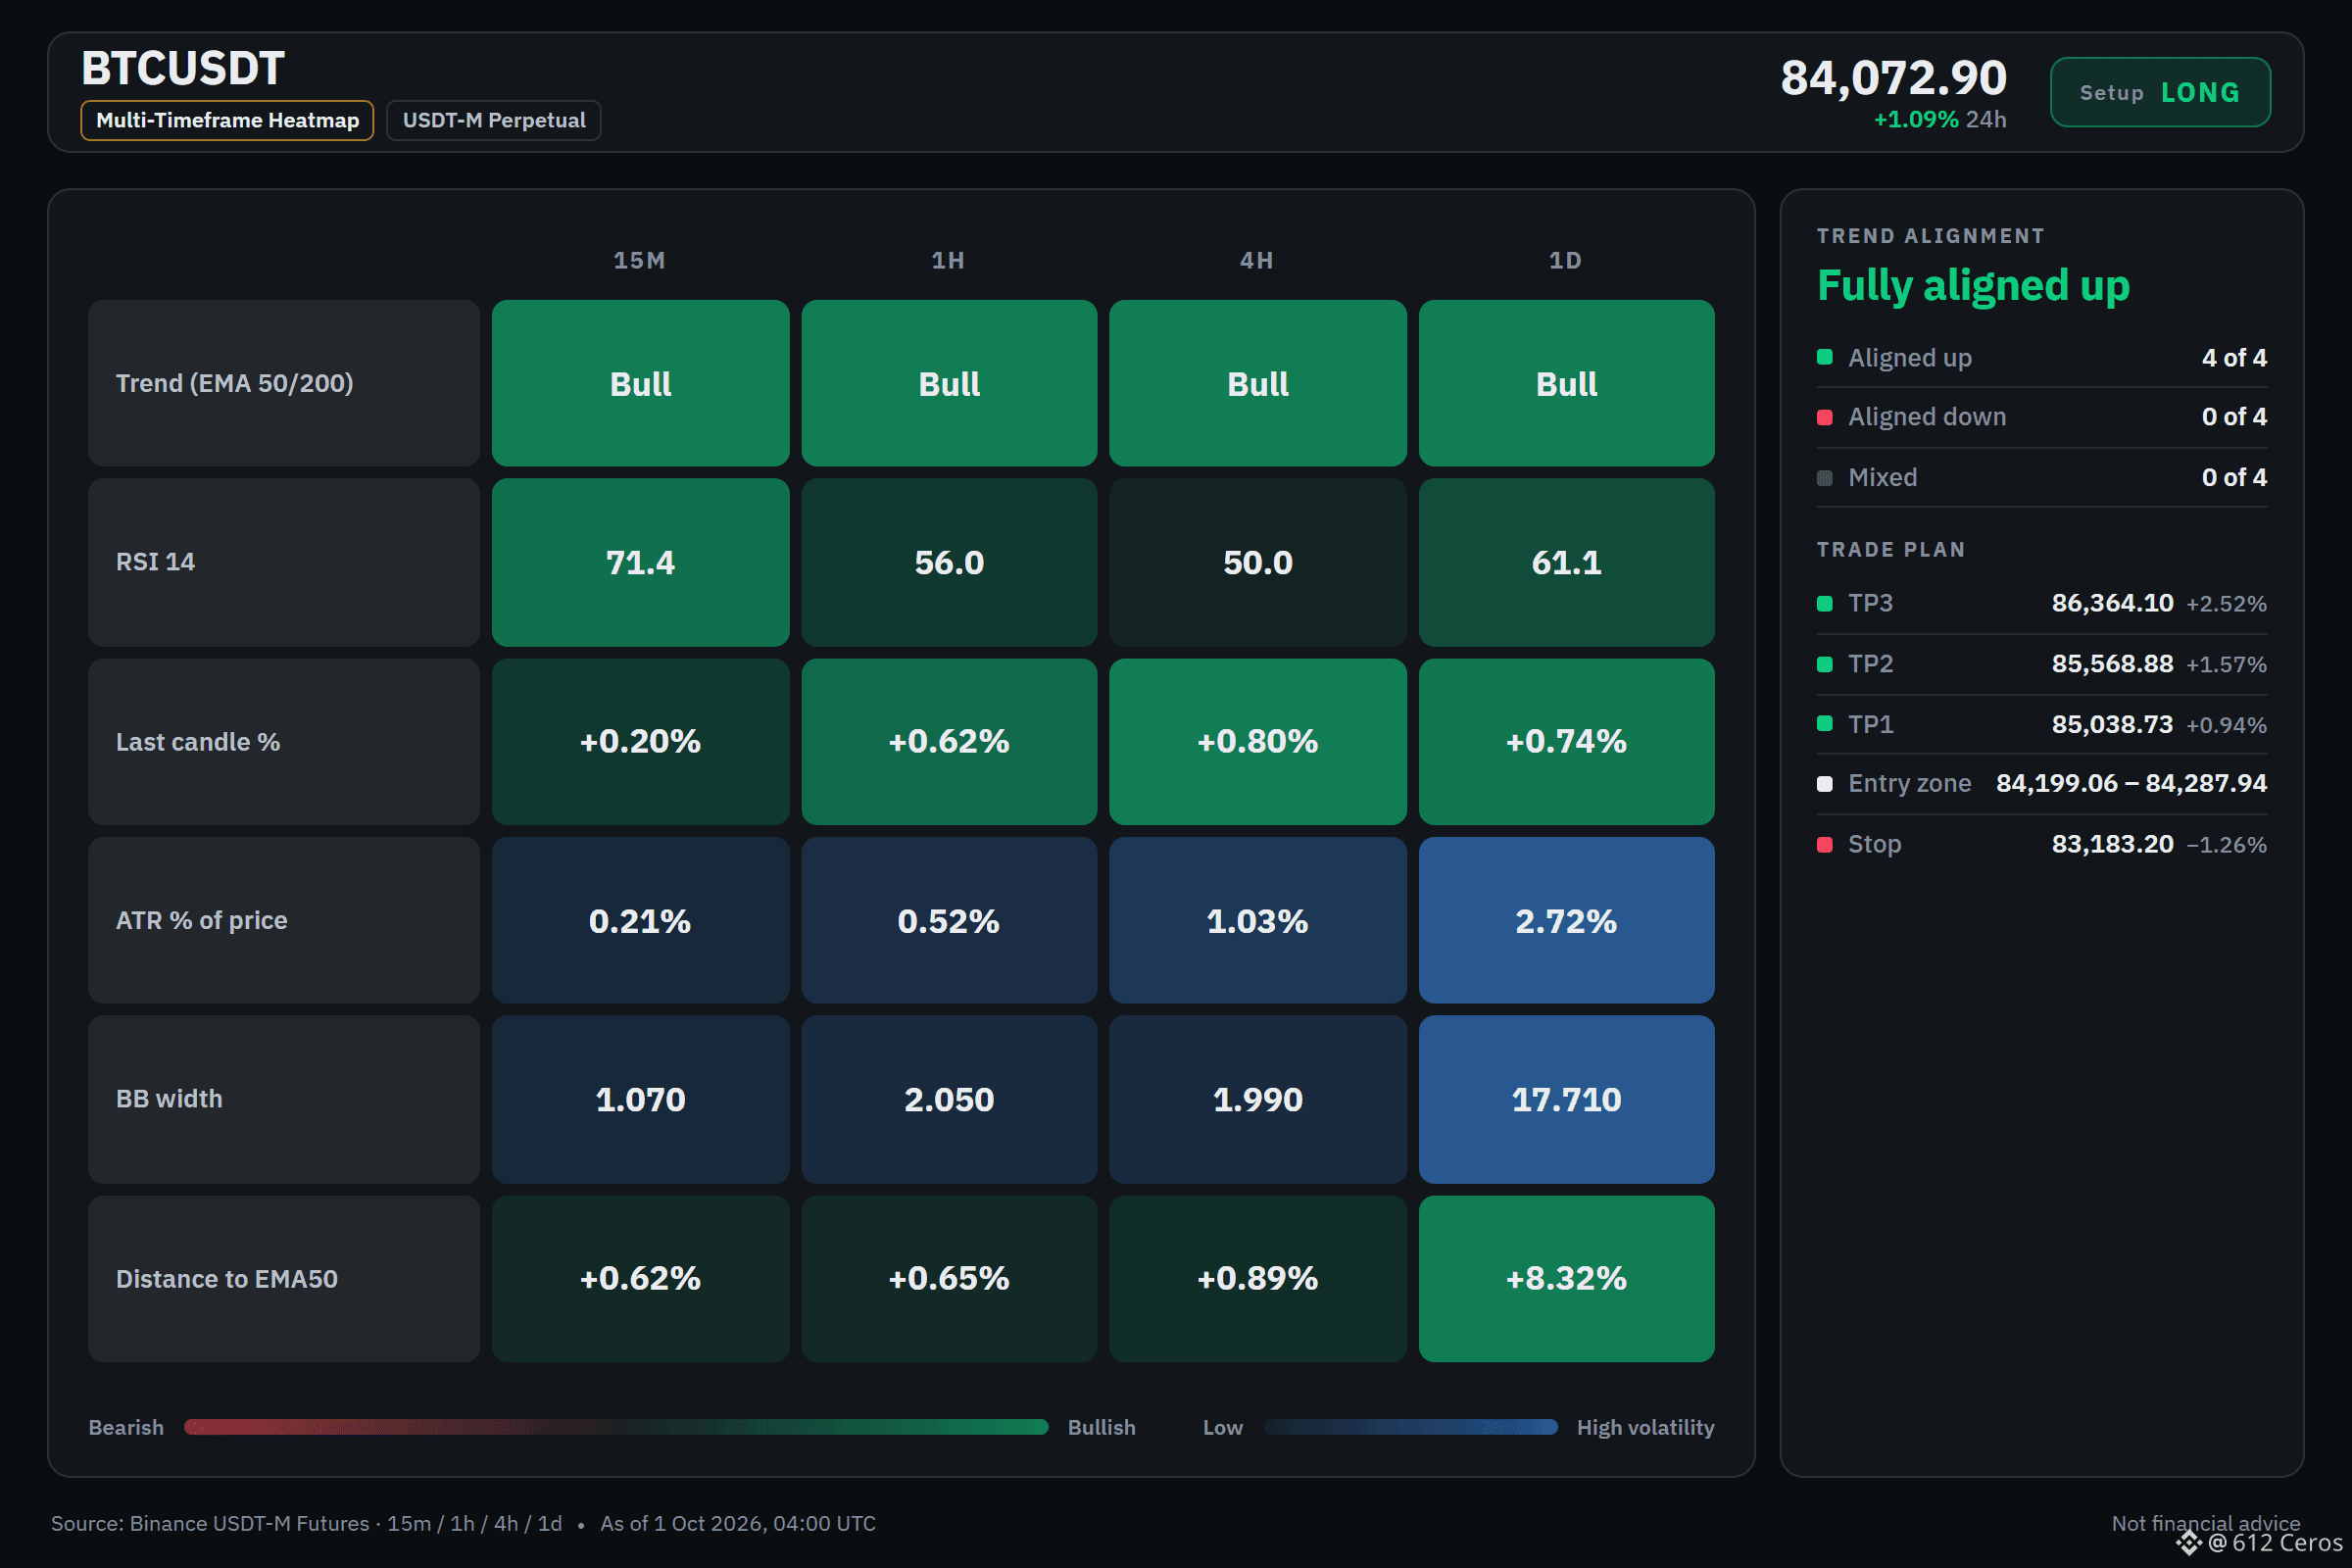
✅ Daily trend: price > EMA50 > EMA200, bullish stack → the big-picture trend is up
✅ 4h trend: price > EMA50 > EMA200, bullish stack → the swing trend is up
✅ 1h trend: price > EMA50 > EMA200, bullish stack → the short-term trend is up
⚠️ RSI extreme in a range: RSI z-score +6.46 in a range, fade-the-high risk → top of a range, sellers often step in
The short version:
1. The daily trend is bullish, price is above the key moving averages, which means the big-picture trend is up.
2. The 1h trend is bullish, and buyers are pressing with an RSI above 55, meaning short-term momentum is positive.
3. The main risk is that the RSI is stretched in a range, which means a fade-the-high is possible.
💬 What is your invalidation level if this long trade goes against you?
Full setup on the chart 👇
📲 Want more of my latest signals? Join me here:
https://app.binance.com/uni-qr/D26WbL9t
⚠️ Personal market analysis only. NFA — manage risk and DYOR.
Educational content, not investment advice or a recommendation to buy, sell, deposit, or withdraw any asset. No paid promotion or referral/affiliate links.
🟢 LONG $BTC /USDT: expecting price to go UP
Bias: LONG · Strong
📍 Entry: 84199.06 – 84287.94
🎯 TP1: 85038.73 (+0.9%)
🎯 TP2: 85568.88 (+1.6%)
🎯 TP3: 86364.10 (+2.5%)
🛑 SL: 83183.20 (-1.3%)
💡 Enter only inside the zone. Take half at TP1, then move the stop to entry.
Why LONG? Strong call, 7/12 signals agree, 1 against, 4 undecided.
✅ Daily trend: price > EMA50 > EMA200, bullish stack → the big-picture trend is up
✅ 4h trend: price > EMA50 > EMA200, bullish stack → the swing trend is up
✅ 1h trend: price > EMA50 > EMA200, bullish stack → the short-term trend is up
⚠️ RSI extreme in a range: RSI z-score +6.46 in a range, fade-the-high risk → top of a range, sellers often step in
The short version:
1. The daily trend is bullish, price is above the key moving averages, which means the big-picture trend is up.
2. The 1h trend is bullish, and buyers are pressing with an RSI above 55, meaning short-term momentum is positive.
3. The main risk is that the RSI is stretched in a range, which means a fade-the-high is possible.
💬 What is your invalidation level if this long trade goes against you?
Full setup on the chart 👇
📲 Want more of my latest signals? Join me here:
https://app.binance.com/uni-qr/D26WbL9t
⚠️ Personal market analysis only. NFA — manage risk and DYOR.
Educational content, not investment advice or a recommendation to buy, sell, deposit, or withdraw any asset. No paid promotion or referral/affiliate links.