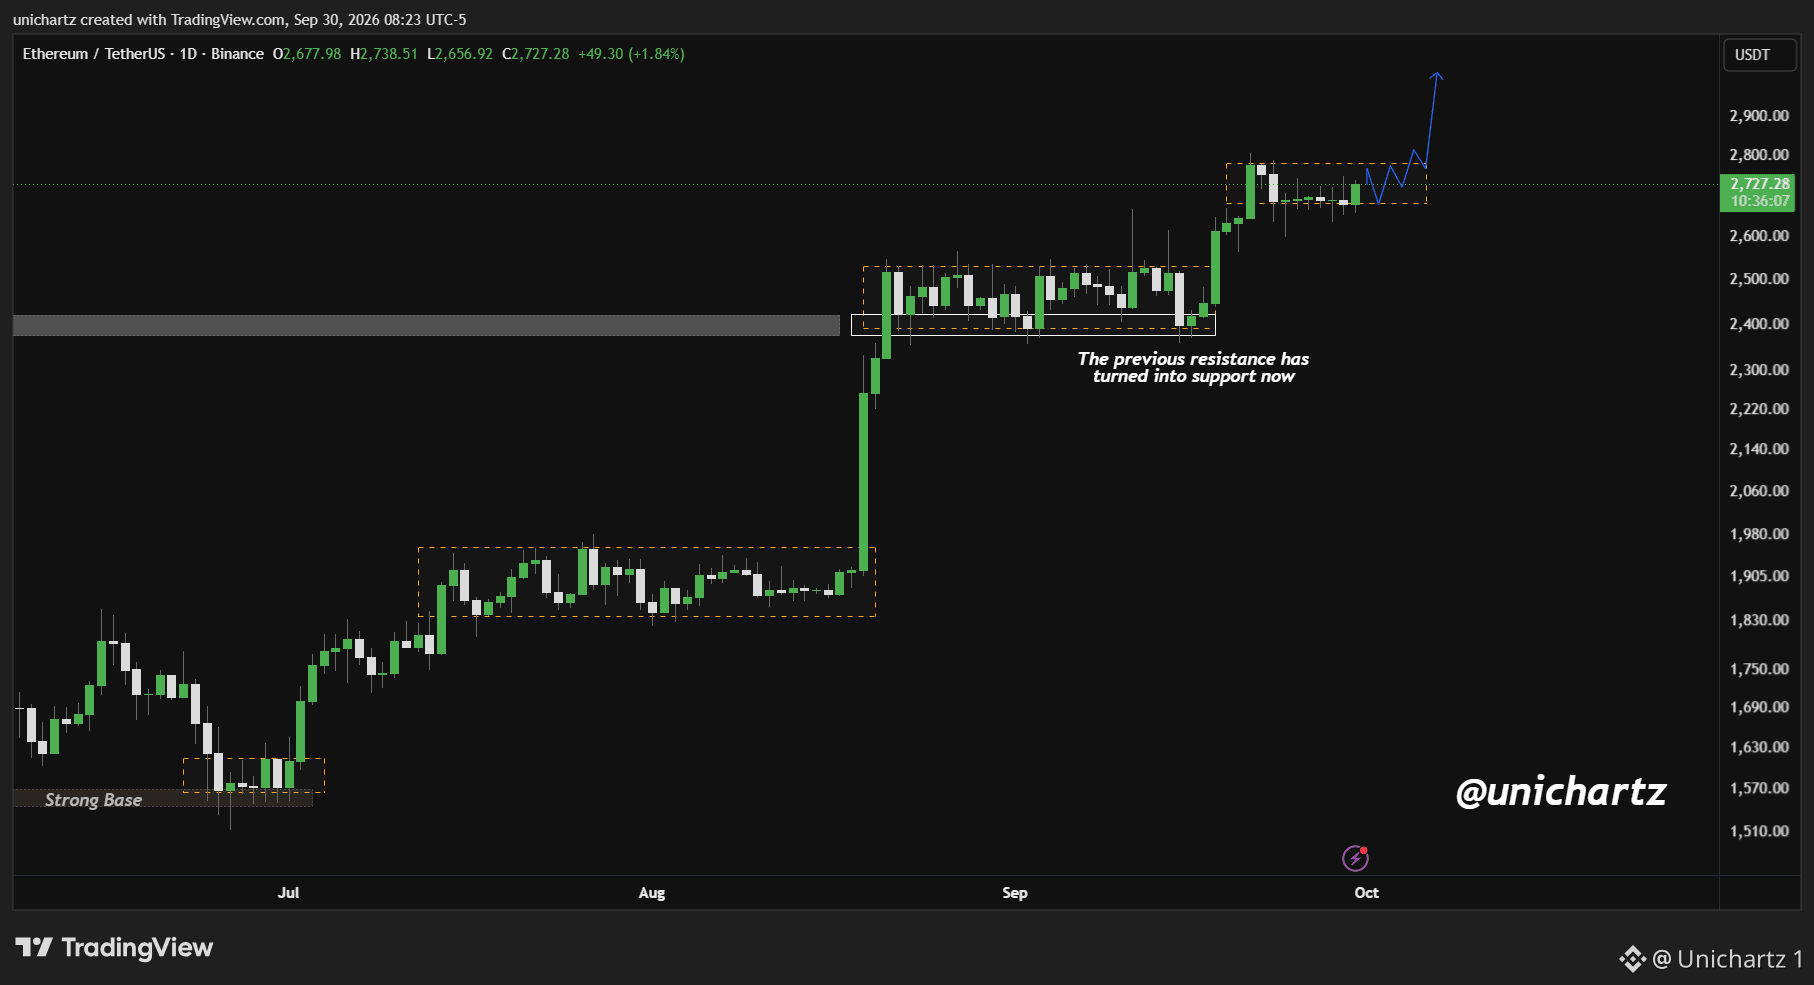
The $ETH chart is telling a clean and confident story right now.
Ethereum built a Strong Base around $1,570 back in July, accumulated quietly for weeks, then exploded higher in August. That breakout was sharp and decisive. What happened next is the part that matters most.
The previous resistance zone around $2,400 was tested as new support, and it held perfectly. That's a textbook flip and one of the strongest confirmations you can get on a daily chart. Price then continued higher and is now trading at $2,727. The blue arrow projection on the chart points toward $2,900+, and structurally nothing on this chart disagrees with that idea.
DYOR, NFA
#ETH #BTC Price Analysis# #Altcoin Season# #BNBChain# $BTC
Ethereum built a Strong Base around $1,570 back in July, accumulated quietly for weeks, then exploded higher in August. That breakout was sharp and decisive. What happened next is the part that matters most.
The previous resistance zone around $2,400 was tested as new support, and it held perfectly. That's a textbook flip and one of the strongest confirmations you can get on a daily chart. Price then continued higher and is now trading at $2,727. The blue arrow projection on the chart points toward $2,900+, and structurally nothing on this chart disagrees with that idea.
DYOR, NFA
#ETH #BTC Price Analysis# #Altcoin Season# #BNBChain# $BTC