
$MOVR Price Prediction: Moonriver Crashed 99.88%, Now Up 230% From the Bottom. Is a 10x Rally Next?
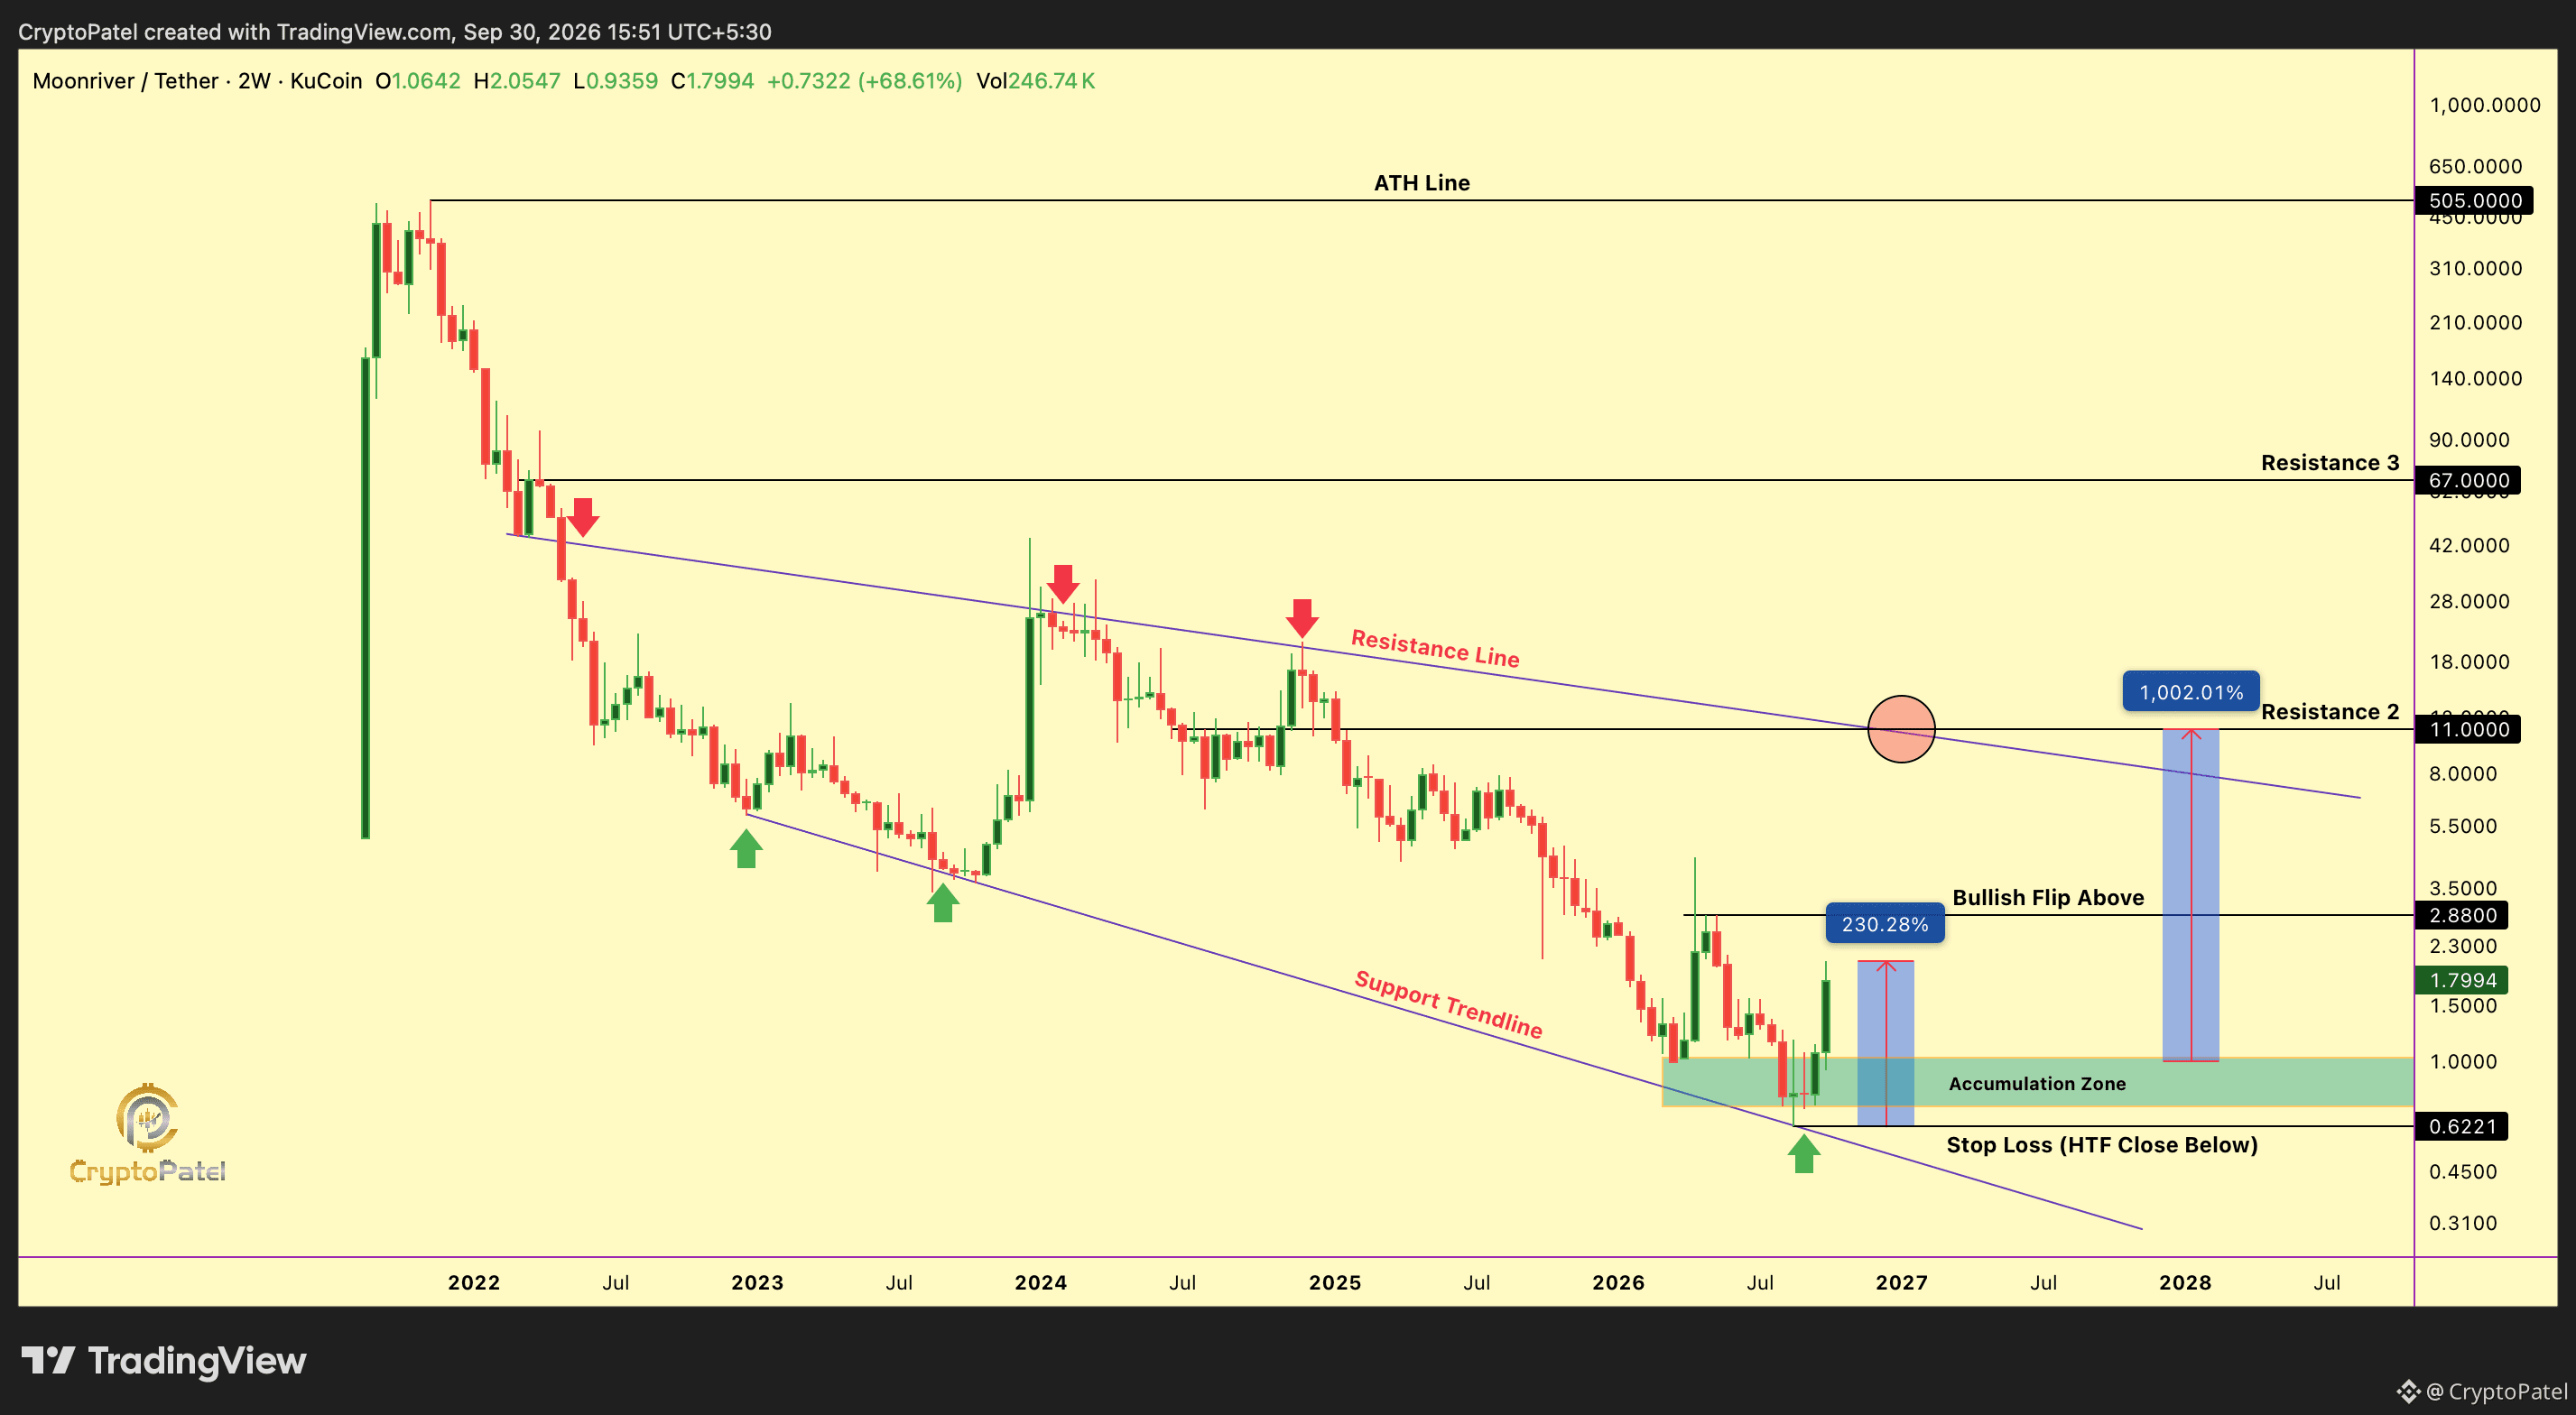
Moonriver crashed 99.88% from its November 2021 ATH of $505 to the August 2026 bottom at $0.6221. From that exact low, MOVR price has rallied 230% to $2.0547 in just over a month, printing its strongest 2-week candle since 2024.
Is this a real Moonriver reversal or exit liquidity? Here is the MOVR technical analysis.
#MOVR Chart Structure:
Since 2022, MOVR has traded inside a descending broadening wedge. In August 2026, price swept the lower trendline at the ATL and reversed with strong volume, a classic capitulation-low signal on the HTF.
✅ ATL liquidity swept at $0.6221
✅ 230% reversal from the August 2026 bottom
✅ Strongest bullish 2W candle since 2024
✅ Third major bounce from wedge support
➡️ Accumulation Zone: $1 – $0.70
➡️ Bullish Flip: $2.88
➡️ Stop Loss: HTF close below $0.6221
MOVR Price Targets: If MOVR breaks and holds above $2.88, the macro trend flips bullish: $2.88 → $10 → $20 → $50
No close and hold above $2.88 means no upside targets.
Moonriver Trading Plan: If price corrects into 1– $0.70, that zone is ideal for accumulation with a tight stop loss at an HTF close below $0.6221.
Moonriver Fundamentals:
MOVR has fully migrated 1:1 to Base as an ERC-20 token. With only about 12.5M MOVR in circulation and over 94% of supply unlocked, it has minimal dilution. At a market cap of around $24M, price can move fast in both directions.
Risk Warning:
This setup is risky. Nobody knows yet whether this pump is a real reversal or exit liquidity. Binance placed MOVR under its Monitoring Tag in August 2026, and open interest is close to the full market cap, which means this rally is heavily leveraged. Avoid chasing green candles, wait for corrections, and always use a stop loss.
TA Only. Not Financial Advice. ALWAYS DYOR.
Moonriver crashed 99.88% from its November 2021 ATH of $505 to the August 2026 bottom at $0.6221. From that exact low, MOVR price has rallied 230% to $2.0547 in just over a month, printing its strongest 2-week candle since 2024.
Is this a real Moonriver reversal or exit liquidity? Here is the MOVR technical analysis.
#MOVR Chart Structure:
Since 2022, MOVR has traded inside a descending broadening wedge. In August 2026, price swept the lower trendline at the ATL and reversed with strong volume, a classic capitulation-low signal on the HTF.
✅ ATL liquidity swept at $0.6221
✅ 230% reversal from the August 2026 bottom
✅ Strongest bullish 2W candle since 2024
✅ Third major bounce from wedge support
➡️ Accumulation Zone: $1 – $0.70
➡️ Bullish Flip: $2.88
➡️ Stop Loss: HTF close below $0.6221
MOVR Price Targets: If MOVR breaks and holds above $2.88, the macro trend flips bullish: $2.88 → $10 → $20 → $50
No close and hold above $2.88 means no upside targets.
Moonriver Trading Plan: If price corrects into 1– $0.70, that zone is ideal for accumulation with a tight stop loss at an HTF close below $0.6221.
Moonriver Fundamentals:
MOVR has fully migrated 1:1 to Base as an ERC-20 token. With only about 12.5M MOVR in circulation and over 94% of supply unlocked, it has minimal dilution. At a market cap of around $24M, price can move fast in both directions.
Risk Warning:
This setup is risky. Nobody knows yet whether this pump is a real reversal or exit liquidity. Binance placed MOVR under its Monitoring Tag in August 2026, and open interest is close to the full market cap, which means this rally is heavily leveraged. Avoid chasing green candles, wait for corrections, and always use a stop loss.
TA Only. Not Financial Advice. ALWAYS DYOR.