📈 $SOMI Trade Setup: Trend Continuation or Retreat?
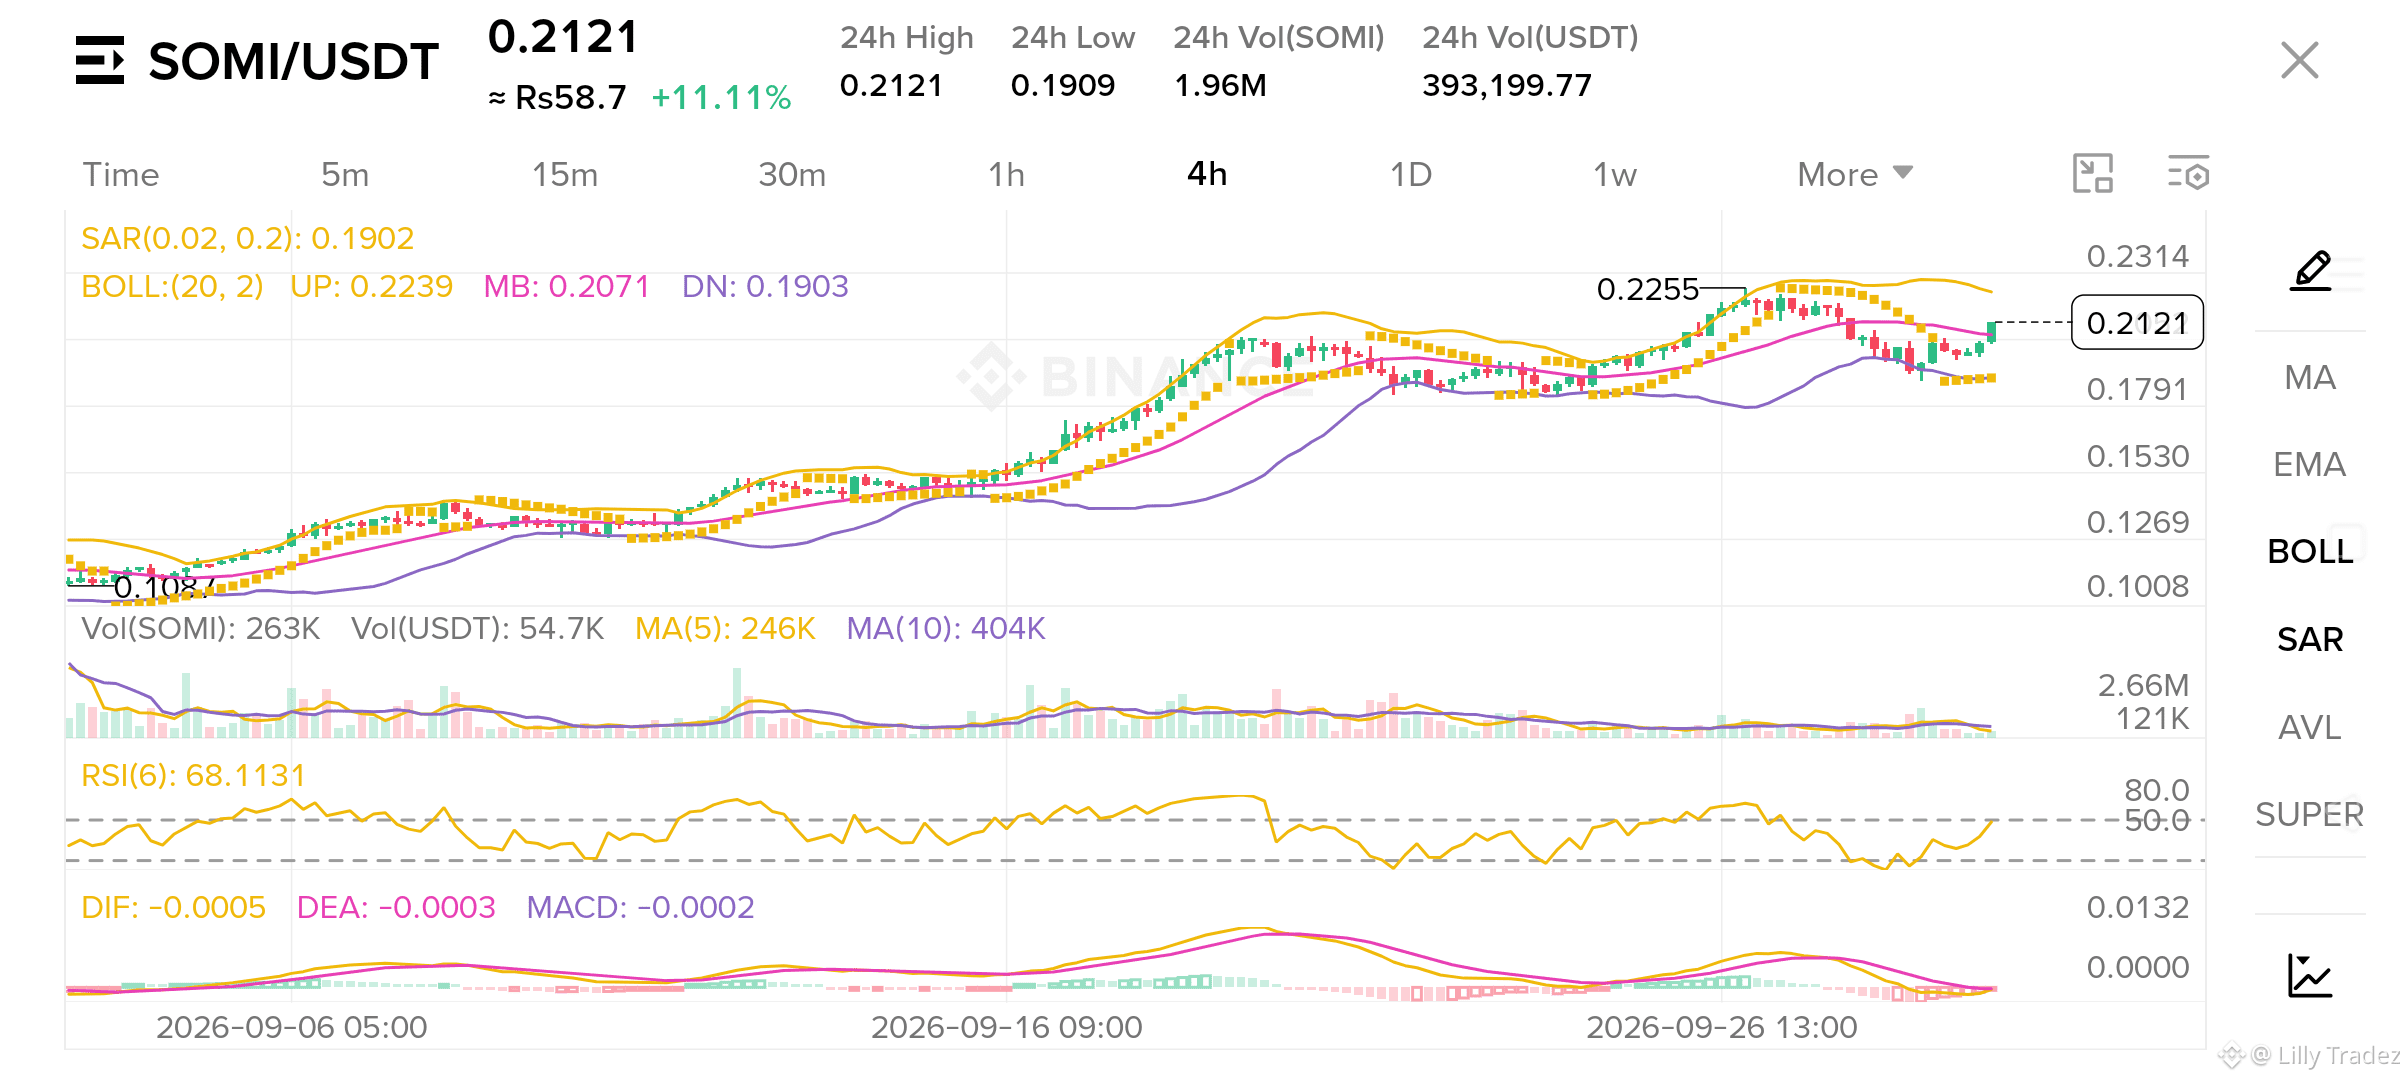
$SOMI/USDT has pushed up to $0.2121, recovering solidly from recent local lows. Here’s how the 4-hour chart breaks down for potential short-term setups:
🔍 Chart Observations:
Moving Averages & MA Support: Volatility is expanding, and short-term moving averages are sloping upward, signalling trend continuation.
MACD / Momentum: Momentum has turned positive after a brief consolidation, supporting the move upward.
Overbought Alert: With the 6-period RSI at 68.11, short-term momentum is high, but price could face resistance near $0.2255.
🎯 Strategy Considerations:
Bullish Scenario: A clean break and 4H candle close above $0.2255 targets the next resistance at $0.2314.
Pullback / Re-entry: Look for potential support bounces around $0.1900–$0.2070 (Middle Bollinger Band & SAR region) for lower-risk entry points.
Risk Management: Set tight stop-losses below $0.1900 to protect capital against sudden market turns.
⚠️ Disclaimer: Not financial advice. Always do your own research (DYOR) and manage your risk carefully.
#TrumpRejectsAIRulesForVoluntaryAudits CryptoTrading #TrumpRejectsAIRulesForVoluntaryAudits Binance #SOMI #TrumpRejectsAIRulesForVoluntaryAudits TechnicalAnalysis #TradingSignals
$SOMI/USDT has pushed up to $0.2121, recovering solidly from recent local lows. Here’s how the 4-hour chart breaks down for potential short-term setups:
🔍 Chart Observations:
Moving Averages & MA Support: Volatility is expanding, and short-term moving averages are sloping upward, signalling trend continuation.
MACD / Momentum: Momentum has turned positive after a brief consolidation, supporting the move upward.
Overbought Alert: With the 6-period RSI at 68.11, short-term momentum is high, but price could face resistance near $0.2255.
🎯 Strategy Considerations:
Bullish Scenario: A clean break and 4H candle close above $0.2255 targets the next resistance at $0.2314.
Pullback / Re-entry: Look for potential support bounces around $0.1900–$0.2070 (Middle Bollinger Band & SAR region) for lower-risk entry points.
Risk Management: Set tight stop-losses below $0.1900 to protect capital against sudden market turns.
⚠️ Disclaimer: Not financial advice. Always do your own research (DYOR) and manage your risk carefully.
#TrumpRejectsAIRulesForVoluntaryAudits CryptoTrading #TrumpRejectsAIRulesForVoluntaryAudits Binance #SOMI #TrumpRejectsAIRulesForVoluntaryAudits TechnicalAnalysis #TradingSignals