🚨🔥 $QNT USDT PERP — BULLISH MOMENTUM SIGNAL 🔥🚨
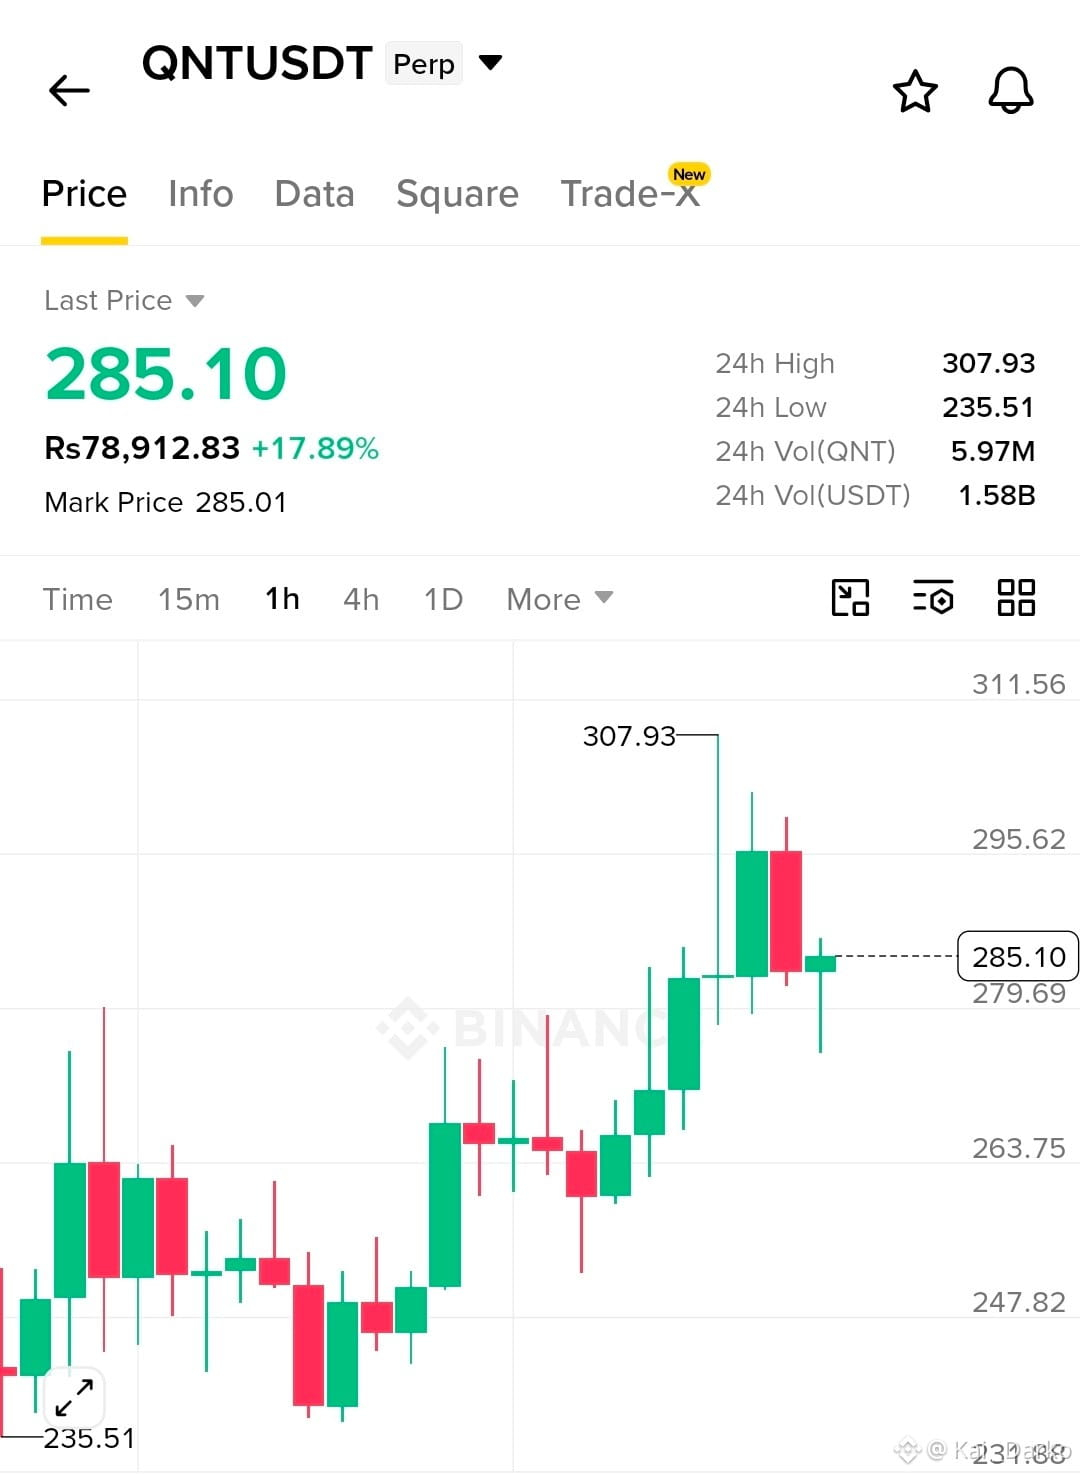
QNTUSDT is showing a strong bullish move on the 1H chart. Price is currently around $285.10, up approximately 17.89%, with heavy 24H volume near $1.58B USDT. The move from the $235.51 low toward $307.93 shows aggressive buying pressure.
After reaching $307.93, QNTUSDT pulled back toward the $279–$285 area and is currently trying to stabilize. This zone is important because the previous breakout area around $279.69 can now act as support.
🎯 QNTUSDT LONG SIGNAL
🟢 Entry (EP): $282.00 – $286.00
🎯 Take Profit 1: $295.50
🎯 Take Profit 2: $307.90
🎯 Take Profit 3: $318.00
🛑 Stop Loss: $276.50
📌 Trade idea:
As long as QNTUSDT holds above the $279–$276 support area, the bullish structure remains interesting. A clean move above $295.60 could bring the previous high near $307.93 back into focus. If buyers manage to break and hold above $307.93, the next upside expansion could open toward the $318 area.
⚠️ Important: This is a chart-based setup, not a guarantee. QNTUSDT has already made a large move, so volatility can be extremely high. Avoid chasing a vertical candle, keep position size controlled, and never risk more than you can afford to lose.
🔥 Key levels to watch:
$279.69 = important support
$295.62 = first major resistance
$307.93 = breakout/high level
$276.50 = invalidation area
If $279 fails decisively, the bullish setup becomes weaker and a deeper pullback toward $263–$264 becomes possible.
🚀 QNTUSDT is at a critical decision zone now — either buyers reclaim the highs, or the market needs more time to cool down.
QNTUSDT — WATCH THE $295.60 → $307.93 BREAKOUT ZONE! 🔥📈
QNTUSDT is showing a strong bullish move on the 1H chart. Price is currently around $285.10, up approximately 17.89%, with heavy 24H volume near $1.58B USDT. The move from the $235.51 low toward $307.93 shows aggressive buying pressure.
After reaching $307.93, QNTUSDT pulled back toward the $279–$285 area and is currently trying to stabilize. This zone is important because the previous breakout area around $279.69 can now act as support.
🎯 QNTUSDT LONG SIGNAL
🟢 Entry (EP): $282.00 – $286.00
🎯 Take Profit 1: $295.50
🎯 Take Profit 2: $307.90
🎯 Take Profit 3: $318.00
🛑 Stop Loss: $276.50
📌 Trade idea:
As long as QNTUSDT holds above the $279–$276 support area, the bullish structure remains interesting. A clean move above $295.60 could bring the previous high near $307.93 back into focus. If buyers manage to break and hold above $307.93, the next upside expansion could open toward the $318 area.
⚠️ Important: This is a chart-based setup, not a guarantee. QNTUSDT has already made a large move, so volatility can be extremely high. Avoid chasing a vertical candle, keep position size controlled, and never risk more than you can afford to lose.
🔥 Key levels to watch:
$279.69 = important support
$295.62 = first major resistance
$307.93 = breakout/high level
$276.50 = invalidation area
If $279 fails decisively, the bullish setup becomes weaker and a deeper pullback toward $263–$264 becomes possible.
🚀 QNTUSDT is at a critical decision zone now — either buyers reclaim the highs, or the market needs more time to cool down.
QNTUSDT — WATCH THE $295.60 → $307.93 BREAKOUT ZONE! 🔥📈