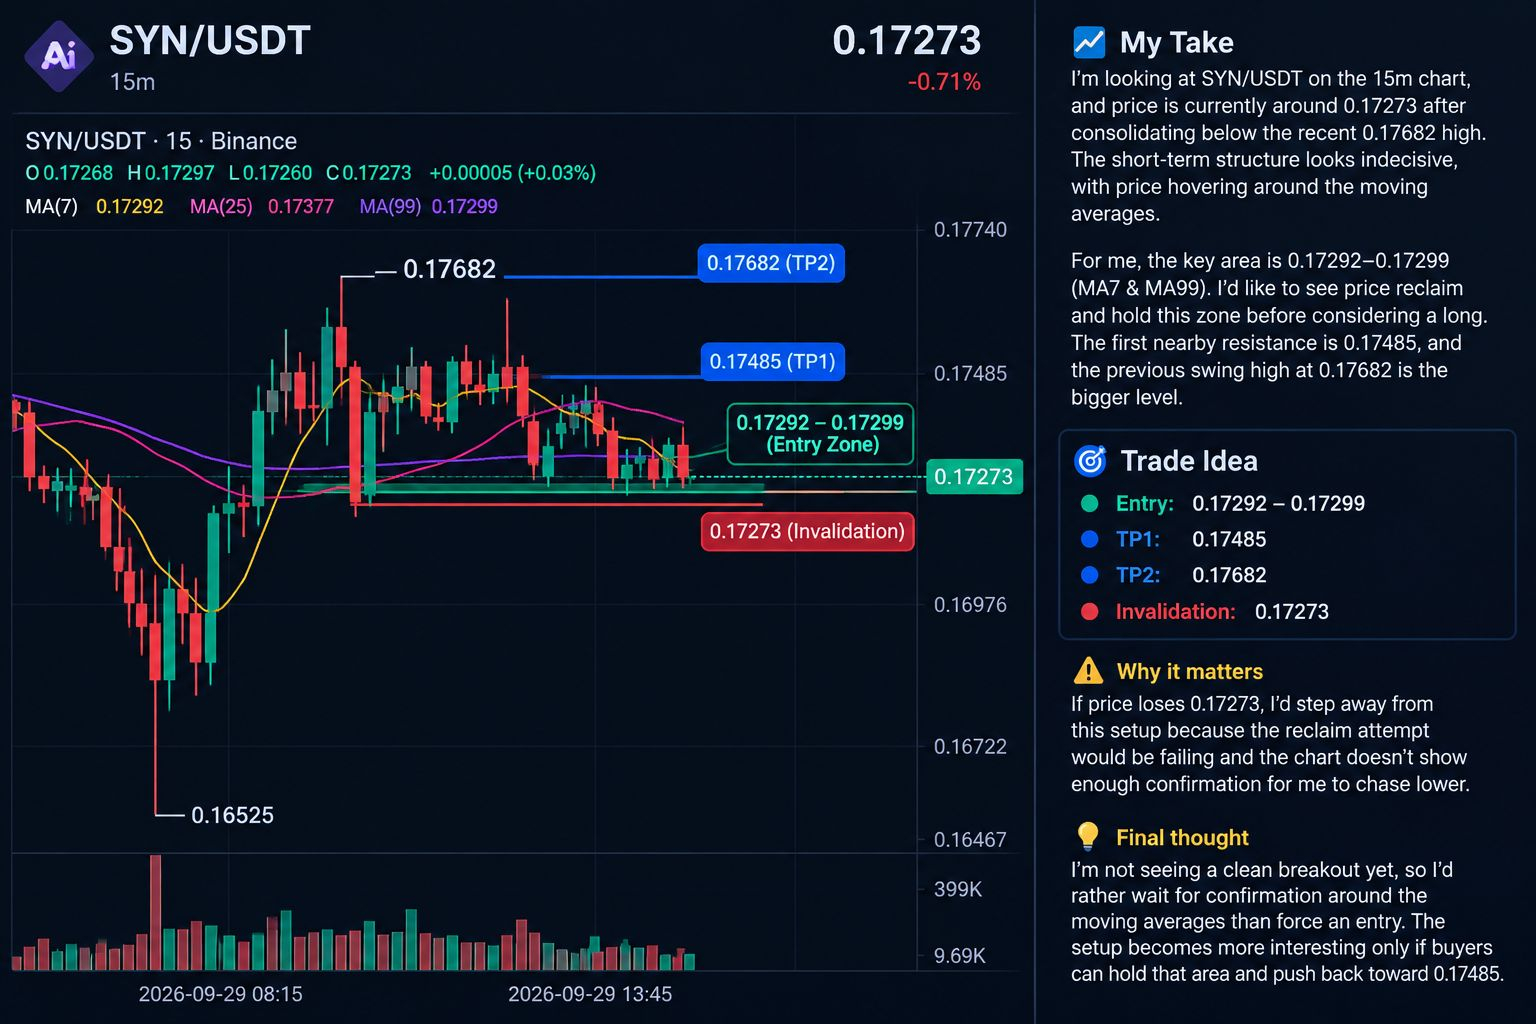
I’m looking at $SYN /USDT on the 15m chart, and price is currently sitting around 0.17273 after consolidating below the recent 0.17682 high. The short-term structure looks indecisive, with price hovering around the visible moving averages.
For me, the key area is 0.17292–0.17299, where MA(7) and MA(99) are sitting. I’d like to see price reclaim and hold this area before considering a long. The first nearby resistance is 0.17485, while the previous swing high at 0.17682 is the bigger level.
📍 Entry: 0.17292–0.17299
🎯 TP1: 0.17485
🎯 TP2: 0.17682
🛑 Invalidation: 0.17273
If price loses 0.17273, I’d step away from this setup because the reclaim attempt would be failing and the chart doesn’t show enough confirmation for me to chase lower.
I’m not seeing a clean breakout yet, so I’d rather wait for confirmation around the moving averages than force an entry. The setup becomes more interesting only if buyers can hold that area and push back toward 0.17485.
For me, the key area is 0.17292–0.17299, where MA(7) and MA(99) are sitting. I’d like to see price reclaim and hold this area before considering a long. The first nearby resistance is 0.17485, while the previous swing high at 0.17682 is the bigger level.
📍 Entry: 0.17292–0.17299
🎯 TP1: 0.17485
🎯 TP2: 0.17682
🛑 Invalidation: 0.17273
If price loses 0.17273, I’d step away from this setup because the reclaim attempt would be failing and the chart doesn’t show enough confirmation for me to chase lower.
I’m not seeing a clean breakout yet, so I’d rather wait for confirmation around the moving averages than force an entry. The setup becomes more interesting only if buyers can hold that area and push back toward 0.17485.