DAILY SIGNAL — SOL/USDT
Date: 28 Sep 2026 Timeframe: 1m Intraday Bias: Bearish continuation → resistance rejection → downside liquidity
📊 Market Bias
SOL remains inside a short-term descending channel after failing to sustain the recovery toward the upper structure.
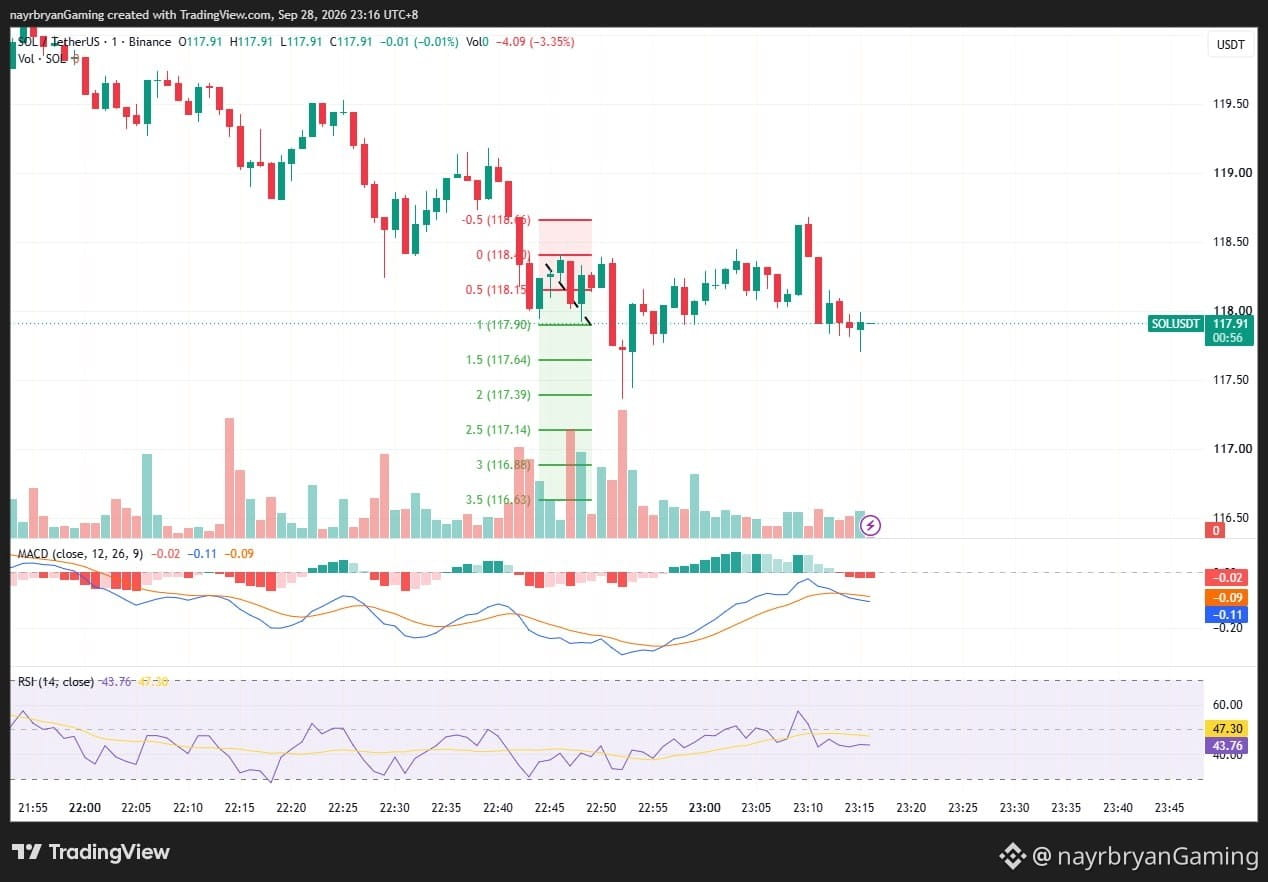
Price recently rejected the 118.40–118.65 purple resistance zone and has rotated lower toward 117.78.
The descending trendline continues to cap upside attempts, keeping the short-term structure bearish.
🔹 Key Levels From Chart
Current Price: 117.78
Key Resistance Zone: 118.40 → 118.65
Secondary Resistance: 118.15
Invalidation: Above 118.65
Key Downside Reference: 117.90
🎯 Downside Fibonacci Targets
TP1 → 117.90 (1.0 Fib) TP2 → 117.64 (1.5 Fib) TP3 → 117.39 (2.0 Fib) TP4 → 117.14 (2.5 Fib) TP5 → 116.88 (3.0 Fib) TP6 → 116.63 (3.5 Fib)
📈 Technical Breakdown
SOL is trading beneath a descending trendline after rejecting the upper purple structure zone.
The latest recovery pushed price back toward the 118.40–118.65 area, but the move was rejected and price returned toward 117.78.
MACD is below the zero line, with the latest histogram showing negative momentum.
RSI is around 41.33, indicating weak momentum without being deeply oversold.
A continued move below 117.90 would keep the downside Fibonacci structure active.
If SOL instead reclaims 118.40–118.65, the bearish setup should be reassessed.
🧠 Quick Insight
“Repeated rejection at resistance keeps the structure vulnerable until price proves otherwise.”
⚠️ Disclaimer
This is personal market analysis, not financial advice. This chart framework is for educational purposes only.
Always DYOR / DYODD, manage risk properly, and avoid emotional trading.
— @nayrbryanGaming #SOL #SOLUSDT #Crypto #Trading #TechnicalAnalysis #PriceAction #Fibonacci #Binance #DYOR #NFA #NoFOMO
Date: 28 Sep 2026 Timeframe: 1m Intraday Bias: Bearish continuation → resistance rejection → downside liquidity
📊 Market Bias
SOL remains inside a short-term descending channel after failing to sustain the recovery toward the upper structure.
Price recently rejected the 118.40–118.65 purple resistance zone and has rotated lower toward 117.78.
The descending trendline continues to cap upside attempts, keeping the short-term structure bearish.
🔹 Key Levels From Chart
Current Price: 117.78
Key Resistance Zone: 118.40 → 118.65
Secondary Resistance: 118.15
Invalidation: Above 118.65
Key Downside Reference: 117.90
🎯 Downside Fibonacci Targets
TP1 → 117.90 (1.0 Fib) TP2 → 117.64 (1.5 Fib) TP3 → 117.39 (2.0 Fib) TP4 → 117.14 (2.5 Fib) TP5 → 116.88 (3.0 Fib) TP6 → 116.63 (3.5 Fib)
📈 Technical Breakdown
SOL is trading beneath a descending trendline after rejecting the upper purple structure zone.
The latest recovery pushed price back toward the 118.40–118.65 area, but the move was rejected and price returned toward 117.78.
MACD is below the zero line, with the latest histogram showing negative momentum.
RSI is around 41.33, indicating weak momentum without being deeply oversold.
A continued move below 117.90 would keep the downside Fibonacci structure active.
If SOL instead reclaims 118.40–118.65, the bearish setup should be reassessed.
🧠 Quick Insight
“Repeated rejection at resistance keeps the structure vulnerable until price proves otherwise.”
⚠️ Disclaimer
This is personal market analysis, not financial advice. This chart framework is for educational purposes only.
Always DYOR / DYODD, manage risk properly, and avoid emotional trading.
— @nayrbryanGaming #SOL #SOLUSDT #Crypto #Trading #TechnicalAnalysis #PriceAction #Fibonacci #Binance #DYOR #NFA #NoFOMO