

TEKT0NIC
1.1k Публикации

TEKT0NIC
Отправить жалобу
Заблокировать пользователя
Trader “19” • Square | CMC Creator • just a dude tweeting in what he believes • BP-AE56D876324A
Открытая сделка
Трейдер с регулярными сделками
3.3 г
9 подписок(и/а)
1.6K+ подписчиков(а)
6.9K+ понравилось
Посты
Портфель
Все
Цитирования
PINNED
·
--
Проверено
🚨 BREAKING: Iran Suspends Peace Talks with US in Protest Over Israel.
Iran has announced it is halting negotiations with the United States, citing Israel’s ongoing military actions in Lebanon as a violation of the ceasefire.
According to Iranian state media (Tasnim) and Foreign Ministry sources, the negotiation team will stop “talks and exchange of texts through intermediaries” until the situation is addressed. Tehran views Israel’s operations as undermining the fragile truce framework.
This development comes amid recent progress on a potential deal involving the Strait of Hormuz reopening and nuclear issues, but highlights how regional tensions (particularly involving Israel) continue to complicate U.S.-Iran diplomacy.
Markets are likely to react with renewed volatility in oil and risk assets.
Iran Halts US Peace Talks Over Israel’s Actions in Lebanon
🚨 BREAKING: Iran Suspends Peace Talks with US in Protest Over Israel.
Iran has announced it is halting negotiations with the United States, citing Israel’s ongoing military actions in Lebanon as a violation of the ceasefire.
According to Iranian state media (Tasnim) and Foreign Ministry sources, the negotiation team will stop “talks and exchange of texts through intermediaries” until the situation is addressed. Tehran views Israel’s operations as undermining the fragile truce framework.
This development comes amid recent progress on a potential deal involving the Strait of Hormuz reopening and nuclear issues, but highlights how regional tensions (particularly involving Israel) continue to complicate U.S.-Iran diplomacy.
Markets are likely to react with renewed volatility in oil and risk assets.
Iran Halts US Peace Talks Over Israel’s Actions in Lebanon
Iran has announced it is halting negotiations with the United States, citing Israel’s ongoing military actions in Lebanon as a violation of the ceasefire.
According to Iranian state media (Tasnim) and Foreign Ministry sources, the negotiation team will stop “talks and exchange of texts through intermediaries” until the situation is addressed. Tehran views Israel’s operations as undermining the fragile truce framework.
This development comes amid recent progress on a potential deal involving the Strait of Hormuz reopening and nuclear issues, but highlights how regional tensions (particularly involving Israel) continue to complicate U.S.-Iran diplomacy.
Markets are likely to react with renewed volatility in oil and risk assets.
Iran Halts US Peace Talks Over Israel’s Actions in Lebanon

43
5
179
186k
·
--
BREAKING: President Trump has rejected iran’s seven-day ceasefire offer, according to u.s. officials cited by the wall street journal. tehran wanted hormuz reopened within a week in exchange for a lift of the naval blockade, easier oil sanctions, and a release of frozen funds. washington is not taking that package. aides say he expects strikes to resume after the november midterms. that report can still shift. it has not been confirmed from the podium.
the market channel is oil, not the headline. hormuz carries about a fifth of seaborne crude and lng in peacetime. a deal that reopened the strait would ease energy prices. a rejection keeps the risk premium in crude and keeps the inflation path sticky. that is the part that can weigh on risk assets.
it is not a fresh war start. this conflict has already run through multiple truces, a june memorandum, and a july collapse. bitcoin and equities have been trading that on-off tape all year. when talks looked closer, oil fell and bitcoin bid. when talks failed, oil firmed and crypto gave some of it back.
weekend crypto is still holding near $84k after a $2.39 billion etf week. that bid is already on the board. monday oil and the dollar will tell you if this headline is being treated as new escalation or as another delay. a spike in brent with a stronger dollar is the risk-off mix. flat oil means the market already had this outcome in the price.
treat it as a bid for energy and a headwind for duration, not as an automatic dump in bitcoin. the next data point is whether hormuz traffic stays blocked and whether crude follows the headline. that is what marks this, not the word ceasefire.
BREAKING: President Trump has rejected iran’s seven-day ceasefire offer, according to u.s. officials cited by the wall street journal. tehran wanted hormuz reopened within a week in exchange for a lift of the naval blockade, easier oil sanctions, and a release of frozen funds. washington is not taking that package. aides say he expects strikes to resume after the november midterms. that report can still shift. it has not been confirmed from the podium.
the market channel is oil, not the headline. hormuz carries about a fifth of seaborne crude and lng in peacetime. a deal that reopened the strait would ease energy prices. a rejection keeps the risk premium in crude and keeps the inflation path sticky. that is the part that can weigh on risk assets.
it is not a fresh war start. this conflict has already run through multiple truces, a june memorandum, and a july collapse. bitcoin and equities have been trading that on-off tape all year. when talks looked closer, oil fell and bitcoin bid. when talks failed, oil firmed and crypto gave some of it back.
weekend crypto is still holding near $84k after a $2.39 billion etf week. that bid is already on the board. monday oil and the dollar will tell you if this headline is being treated as new escalation or as another delay. a spike in brent with a stronger dollar is the risk-off mix. flat oil means the market already had this outcome in the price.
treat it as a bid for energy and a headwind for duration, not as an automatic dump in bitcoin. the next data point is whether hormuz traffic stays blocked and whether crude follows the headline. that is what marks this, not the word ceasefire.
the market channel is oil, not the headline. hormuz carries about a fifth of seaborne crude and lng in peacetime. a deal that reopened the strait would ease energy prices. a rejection keeps the risk premium in crude and keeps the inflation path sticky. that is the part that can weigh on risk assets.
it is not a fresh war start. this conflict has already run through multiple truces, a june memorandum, and a july collapse. bitcoin and equities have been trading that on-off tape all year. when talks looked closer, oil fell and bitcoin bid. when talks failed, oil firmed and crypto gave some of it back.
weekend crypto is still holding near $84k after a $2.39 billion etf week. that bid is already on the board. monday oil and the dollar will tell you if this headline is being treated as new escalation or as another delay. a spike in brent with a stronger dollar is the risk-off mix. flat oil means the market already had this outcome in the price.
treat it as a bid for energy and a headwind for duration, not as an automatic dump in bitcoin. the next data point is whether hormuz traffic stays blocked and whether crude follows the headline. that is what marks this, not the word ceasefire.

1
567
·
--
Рост
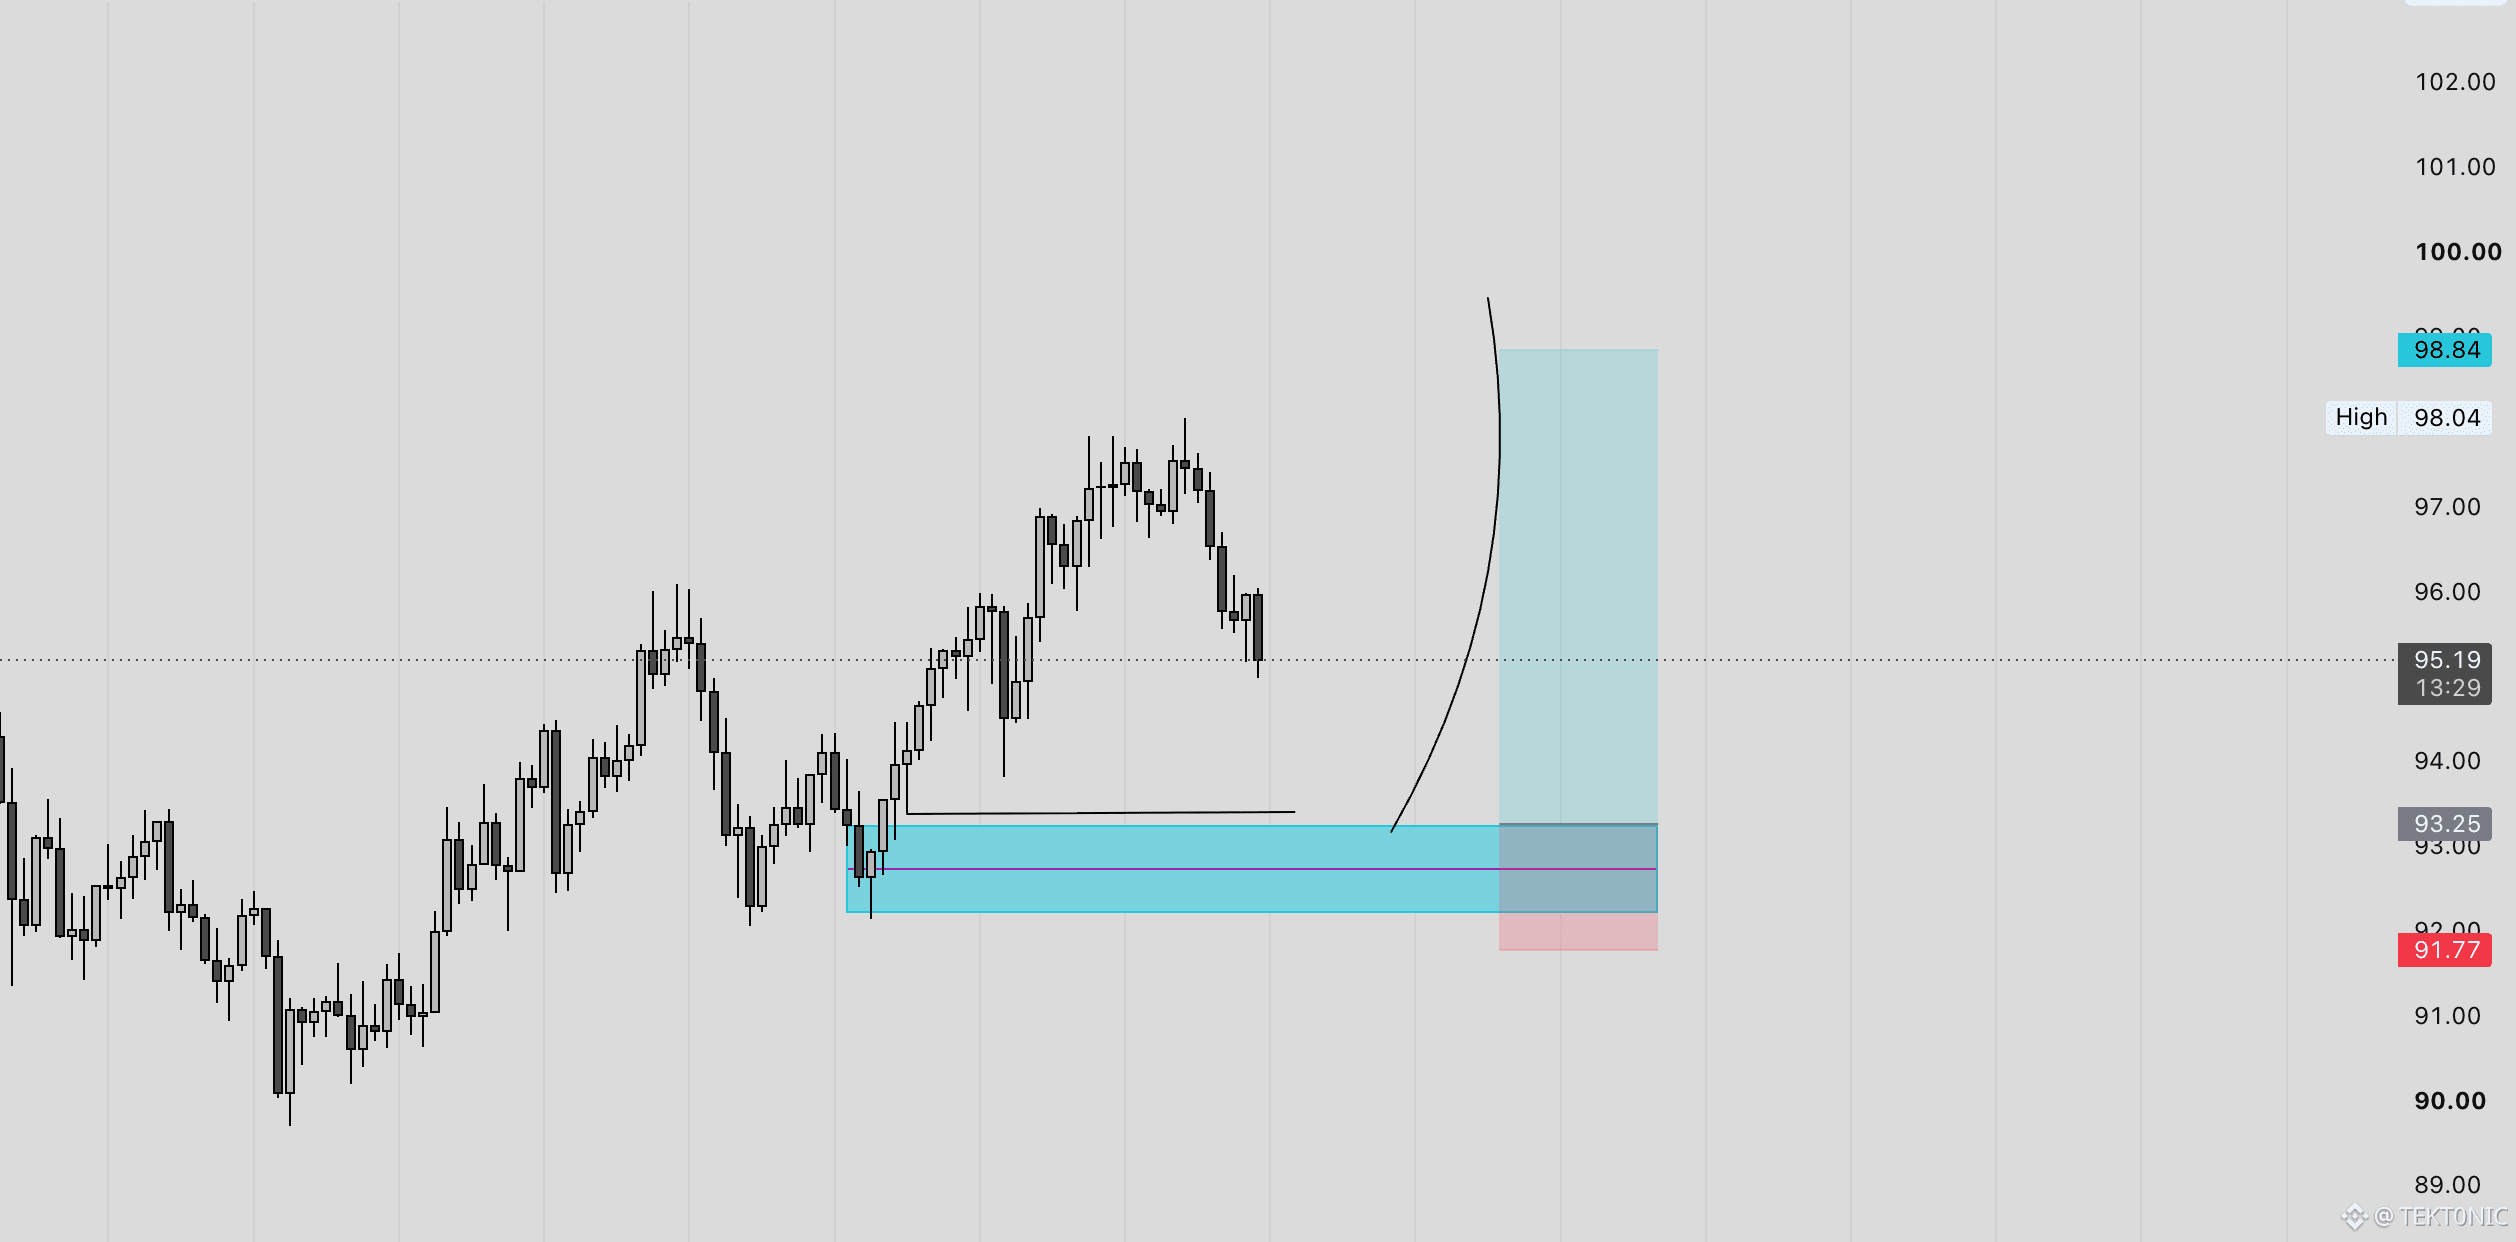
HYPE is sitting above a key demand zone 👀
price is currently around $95.19 after pulling back from the $97+ area.
the zone i’m watching for entry is around $92.50 - $93.25.
if HYPE retraces into this area and buyers hold the demand, i’d be watching for a move toward $98.84.
the setup is simple:
demand: $93.25
target: ATH
sl: $91.77
if the demand zone holds, HYPE could push back toward the recent highs.
but if price loses $91.77 with strong momentum, this setup is invalidated.
for now, i’m watching how price reacts around demand. ^^
DYOR.
HYPE is sitting above a key demand zone 👀
price is currently around $95.19 after pulling back from the $97+ area.
the zone i’m watching for entry is around $92.50 - $93.25.
if HYPE retraces into this area and buyers hold the demand, i’d be watching for a move toward $98.84.
the setup is simple:
demand: $93.25
target: ATH
sl: $91.77
if the demand zone holds, HYPE could push back toward the recent highs.
but if price loses $91.77 with strong momentum, this setup is invalidated.
for now, i’m watching how price reacts around demand. ^^
DYOR.
price is currently around $95.19 after pulling back from the $97+ area.
the zone i’m watching for entry is around $92.50 - $93.25.
if HYPE retraces into this area and buyers hold the demand, i’d be watching for a move toward $98.84.
the setup is simple:
demand: $93.25
target: ATH
sl: $91.77
if the demand zone holds, HYPE could push back toward the recent highs.
but if price loses $91.77 with strong momentum, this setup is invalidated.
for now, i’m watching how price reacts around demand. ^^
DYOR.
2
338
·
--
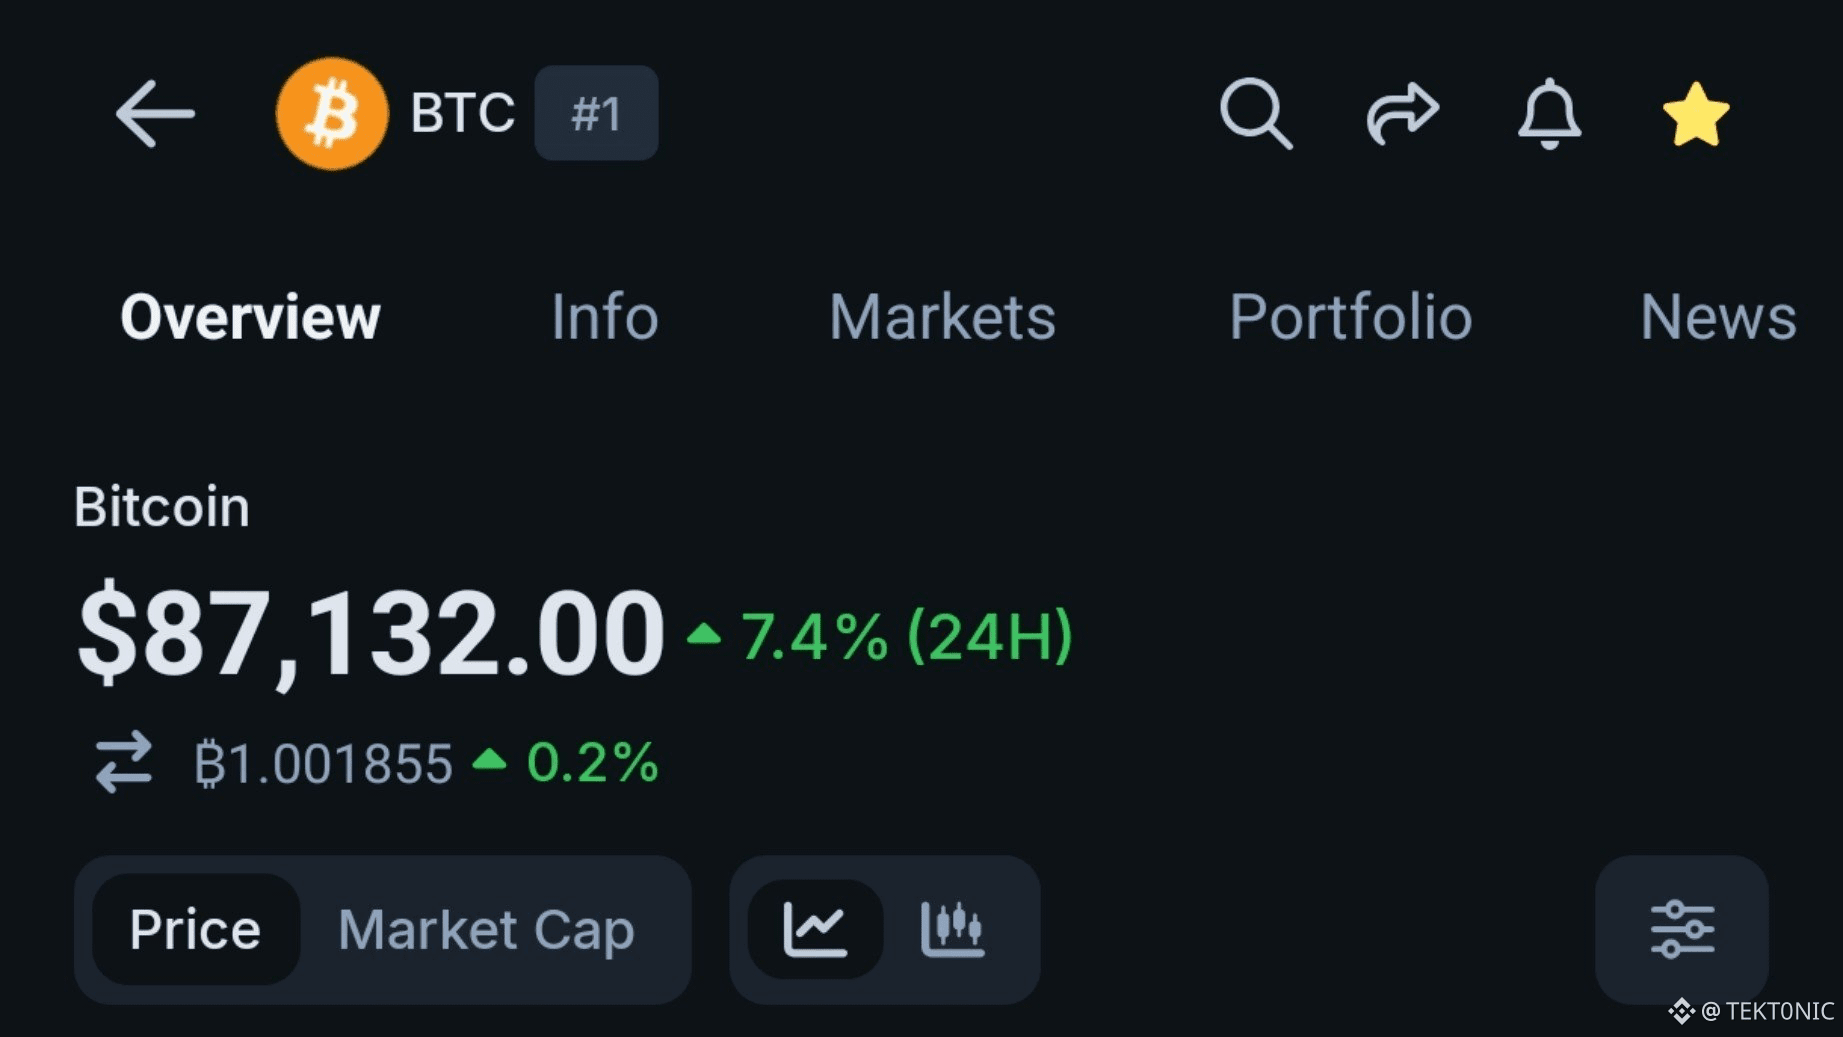
BTC is back above $87K, and the move has been pretty aggressive.
bitcoin climbed from around $75K last week to $87.3K today, putting it up roughly 7% in 24 hours and at its highest level since late January.
the move also came with a huge amount of short liquidations.
more than $900M in crypto shorts were liquidated over the past 24 hours, with Bitcoin accounting for more than $550M of those liquidations.
that helps explain why the move happened so quickly.
once BTC pushed through the $80K area, short sellers started getting forced out, adding more buying pressure to an already strong move.
and now the market is back at a level we haven’t seen since the beginning of the year.
$75K → $80K → $87K
that’s a serious recovery in just a few days.
now the question is whether BTC can turn this move into sustained momentum instead of another sharp bounce.
either way, 7% in 24 hours is not a move you ignore.
BTC is back above $87K, and the move has been pretty aggressive.
bitcoin climbed from around $75K last week to $87.3K today, putting it up roughly 7% in 24 hours and at its highest level since late January.
the move also came with a huge amount of short liquidations.
more than $900M in crypto shorts were liquidated over the past 24 hours, with Bitcoin accounting for more than $550M of those liquidations.
that helps explain why the move happened so quickly.
once BTC pushed through the $80K area, short sellers started getting forced out, adding more buying pressure to an already strong move.
and now the market is back at a level we haven’t seen since the beginning of the year.
$75K → $80K → $87K
that’s a serious recovery in just a few days.
now the question is whether BTC can turn this move into sustained momentum instead of another sharp bounce.
either way, 7% in 24 hours is not a move you ignore.
bitcoin climbed from around $75K last week to $87.3K today, putting it up roughly 7% in 24 hours and at its highest level since late January.
the move also came with a huge amount of short liquidations.
more than $900M in crypto shorts were liquidated over the past 24 hours, with Bitcoin accounting for more than $550M of those liquidations.
that helps explain why the move happened so quickly.
once BTC pushed through the $80K area, short sellers started getting forced out, adding more buying pressure to an already strong move.
and now the market is back at a level we haven’t seen since the beginning of the year.
$75K → $80K → $87K
that’s a serious recovery in just a few days.
now the question is whether BTC can turn this move into sustained momentum instead of another sharp bounce.
either way, 7% in 24 hours is not a move you ignore.
3
5.1k
·
--
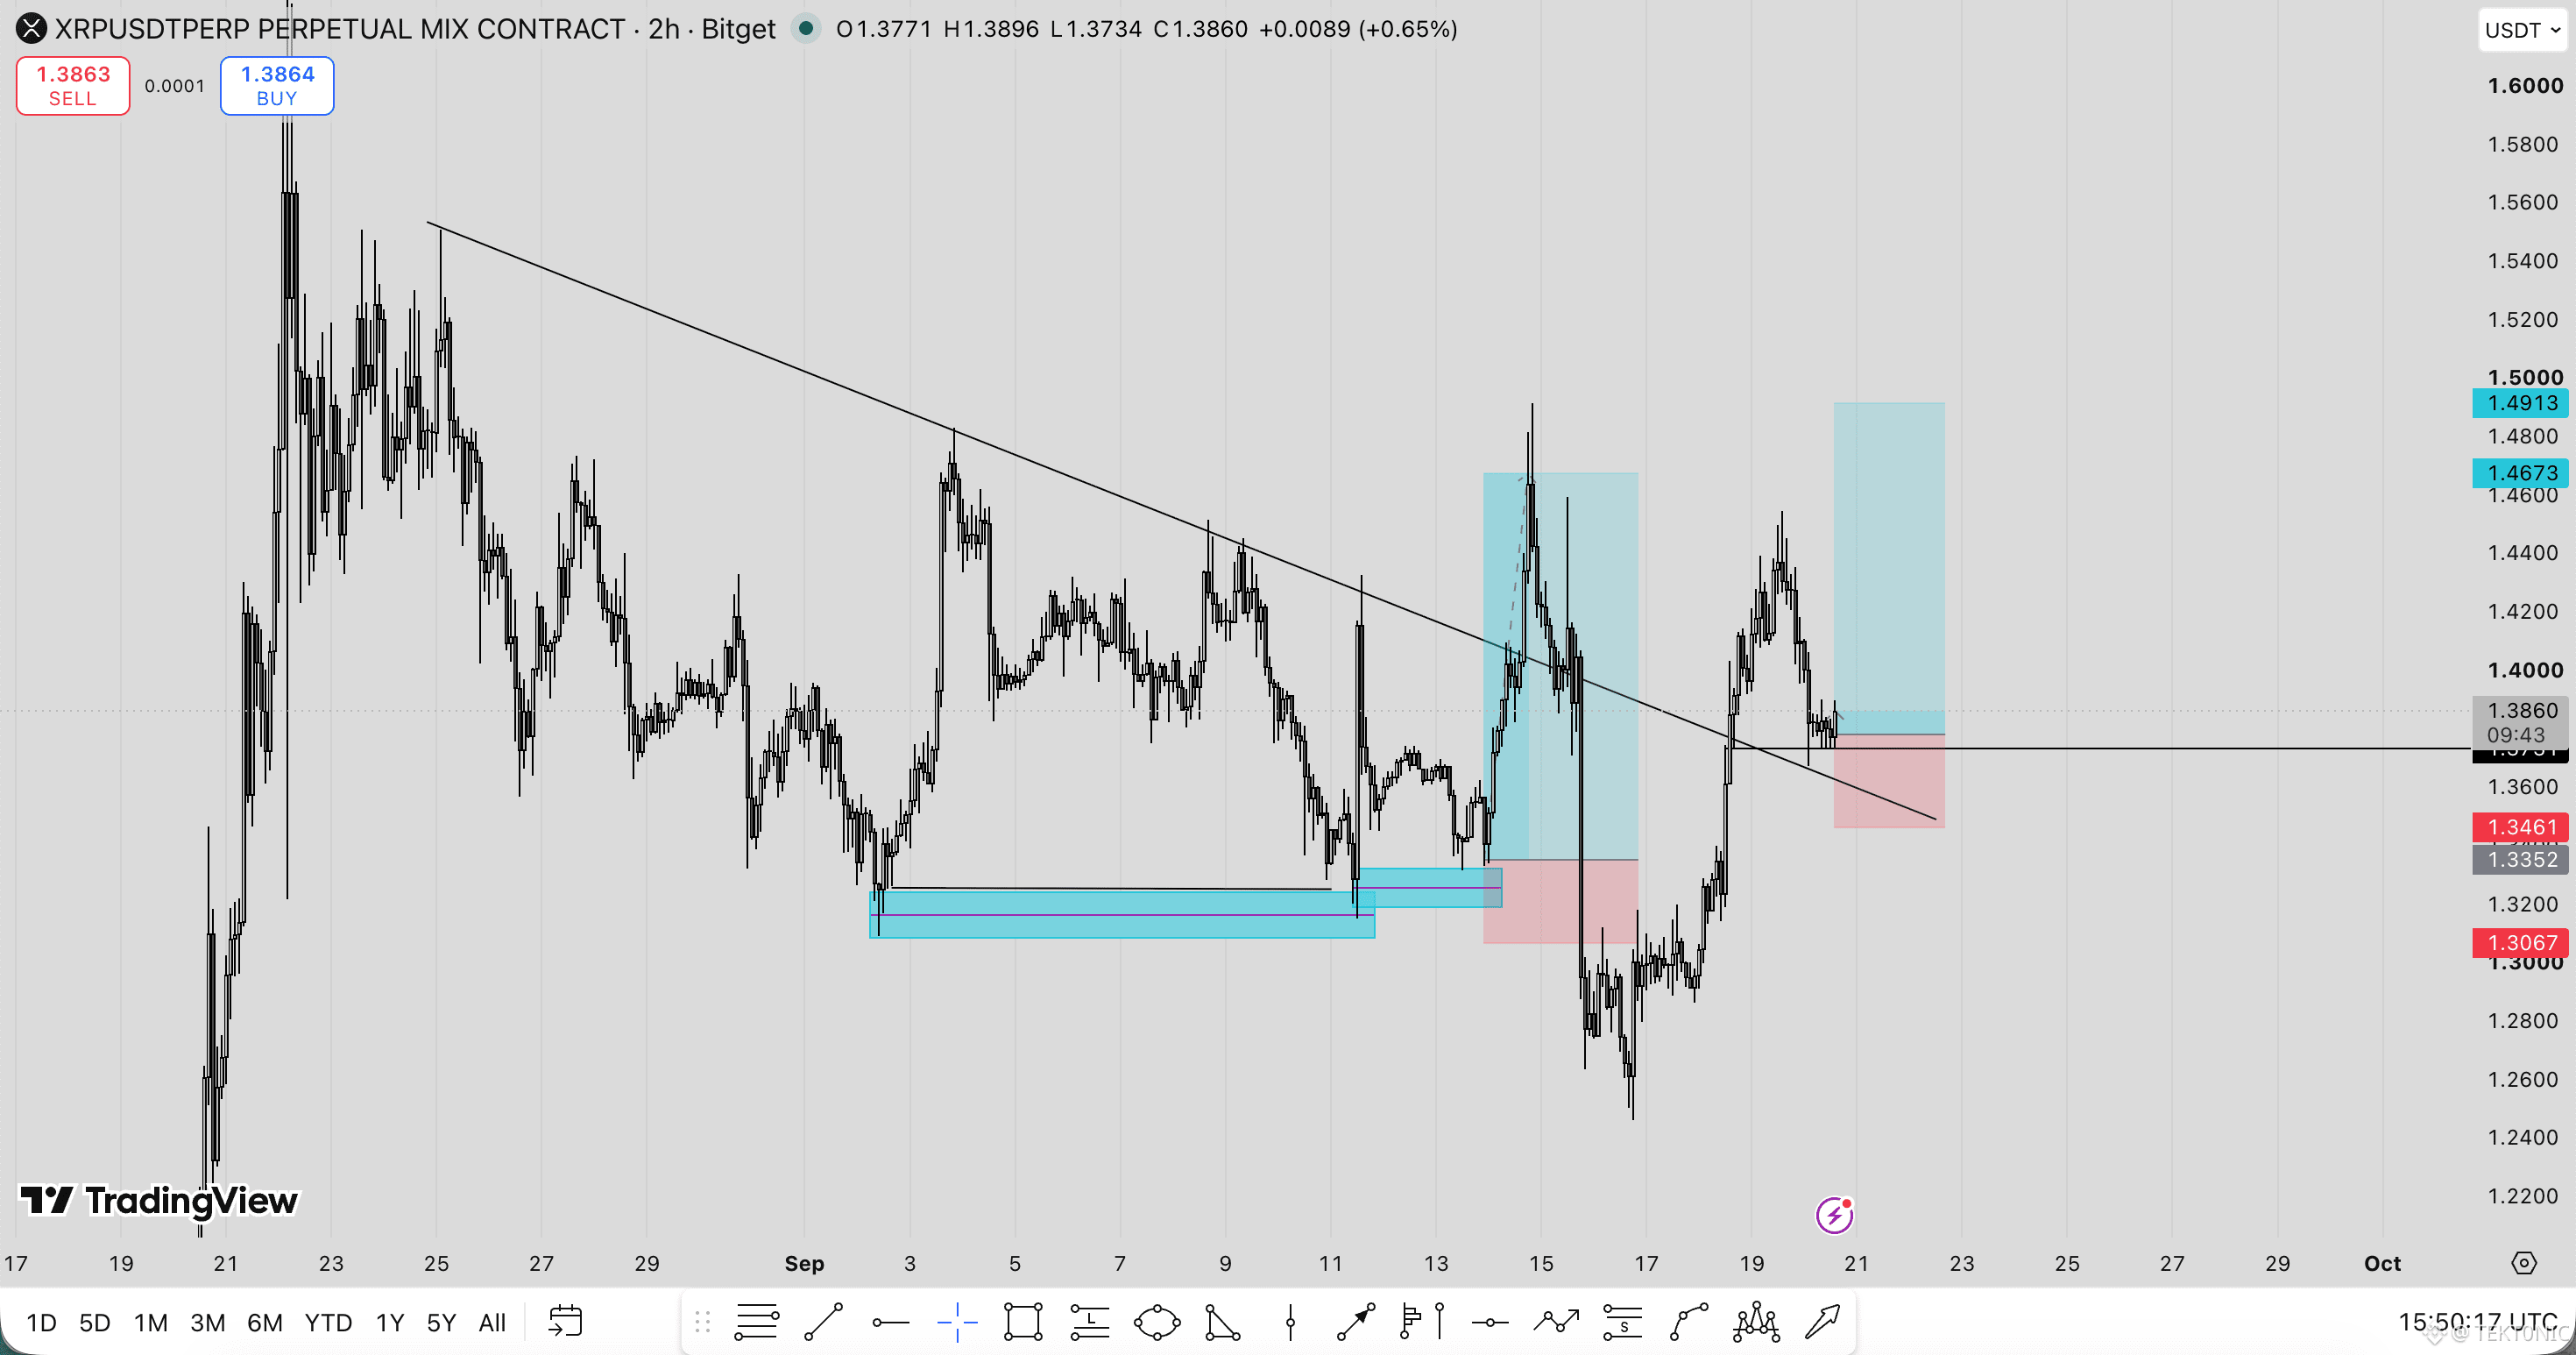
XRP has already broken the descending trendline.
price is currently around $1.386, and i’m watching how it reacts around this level after the recent move higher.
if XRP can hold above the broken trendline and $1.37, i would be looking for entries toward:
Potential targets
- target 1: $1.4673
- target 2: $1.4913
- support: $1.3352
if buyers maintain control, XRP could continue pushing higher.
but if price gets rejected and loses $1.3352, the bullish setup becomes weaker, and i’ll be watching the lower demand around $1.3067.
for now, the reaction around the breakout area is what matters. ^^
DYOR.
XRP has already broken the descending trendline.
price is currently around $1.386, and i’m watching how it reacts around this level after the recent move higher.
if XRP can hold above the broken trendline and $1.37, i would be looking for entries toward:
Potential targets
- target 1: $1.4673
- target 2: $1.4913
- support: $1.3352
if buyers maintain control, XRP could continue pushing higher.
but if price gets rejected and loses $1.3352, the bullish setup becomes weaker, and i’ll be watching the lower demand around $1.3067.
for now, the reaction around the breakout area is what matters. ^^
DYOR.
price is currently around $1.386, and i’m watching how it reacts around this level after the recent move higher.
if XRP can hold above the broken trendline and $1.37, i would be looking for entries toward:
Potential targets
- target 1: $1.4673
- target 2: $1.4913
- support: $1.3352
if buyers maintain control, XRP could continue pushing higher.
but if price gets rejected and loses $1.3352, the bullish setup becomes weaker, and i’ll be watching the lower demand around $1.3067.
for now, the reaction around the breakout area is what matters. ^^
DYOR.
3
10
10.7k
·
--
Рост
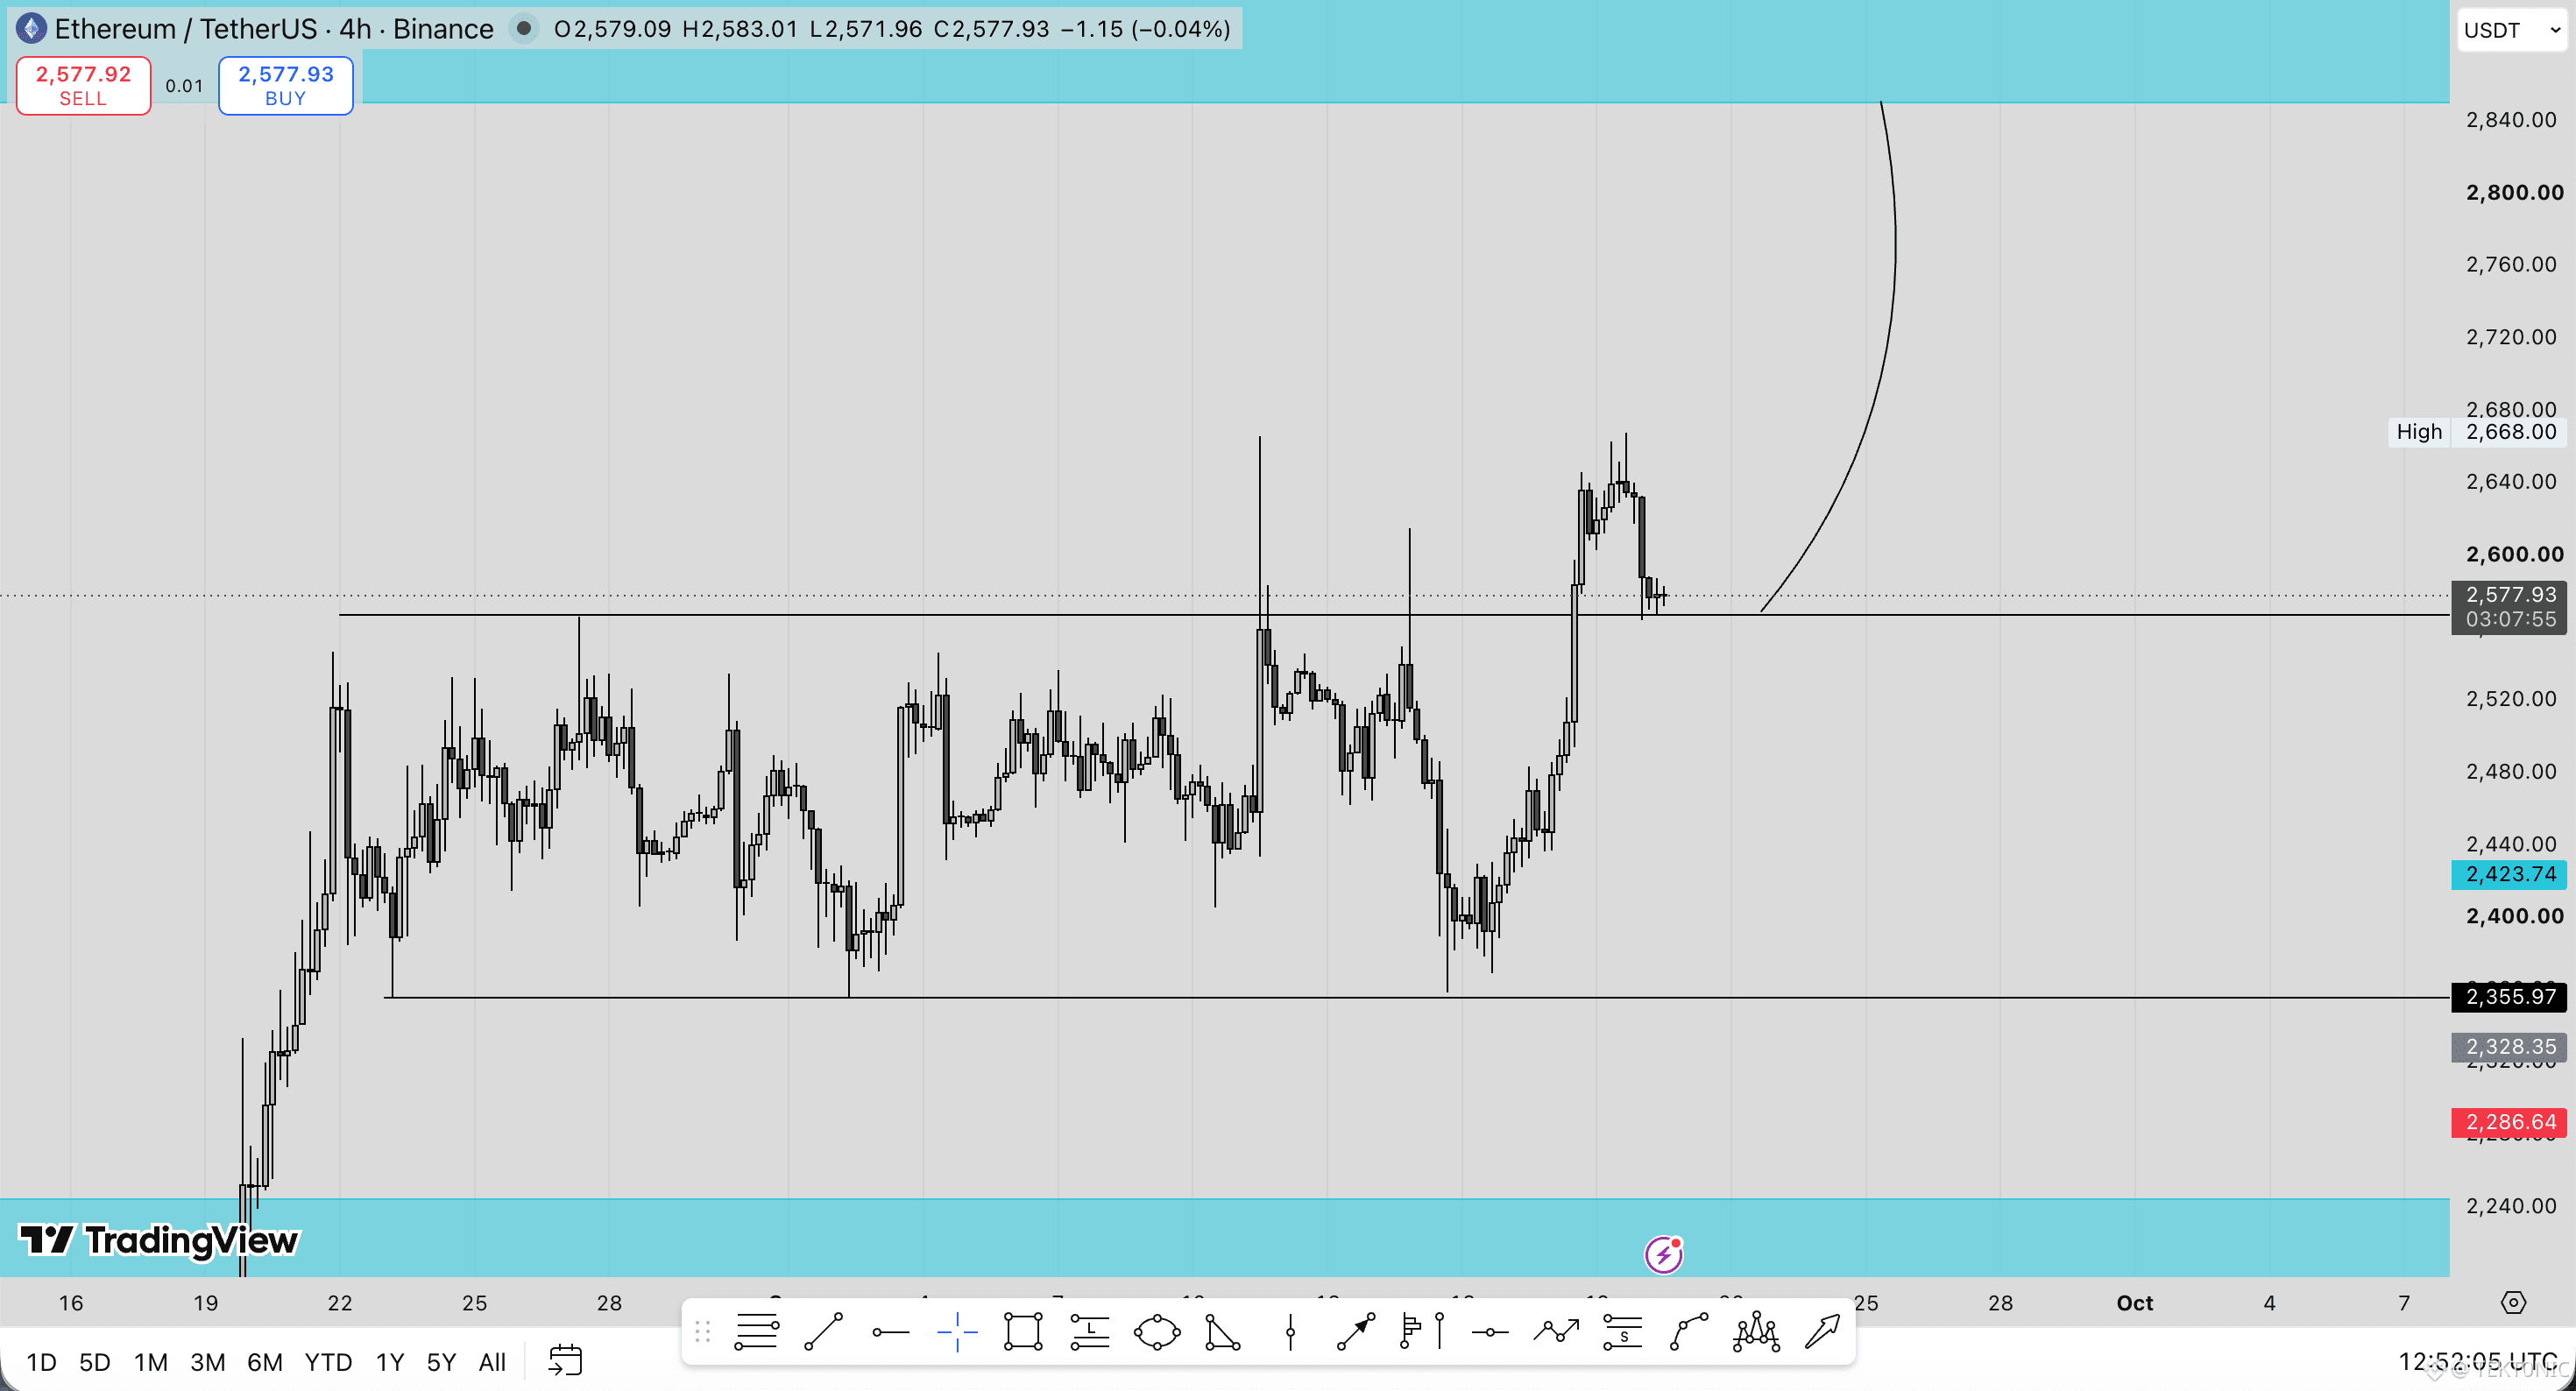
Looks like ETH is about to pump so hard!
ETH has already pushed above the previous range and is now sitting on a key support around $2,578.
This is the level I’ll be watching closely.
If buyers continue holding this support, I would look for a continuation toward $2,840.
If $2,578 holds, the current structure still gives buyers room to push higher.
But if ETH loses this support with strong momentum, I’ll be watching $2,423 and then $2,356 for the next reaction.
For now, ETH is sitting at support after the breakout.
the reaction here could decide the next move. ^^ 👀
Looks like ETH is about to pump so hard!
ETH has already pushed above the previous range and is now sitting on a key support around $2,578.
This is the level I’ll be watching closely.
If buyers continue holding this support, I would look for a continuation toward $2,840.
If $2,578 holds, the current structure still gives buyers room to push higher.
But if ETH loses this support with strong momentum, I’ll be watching $2,423 and then $2,356 for the next reaction.
For now, ETH is sitting at support after the breakout.
the reaction here could decide the next move. ^^ 👀
ETH has already pushed above the previous range and is now sitting on a key support around $2,578.
This is the level I’ll be watching closely.
If buyers continue holding this support, I would look for a continuation toward $2,840.
If $2,578 holds, the current structure still gives buyers room to push higher.
But if ETH loses this support with strong momentum, I’ll be watching $2,423 and then $2,356 for the next reaction.
For now, ETH is sitting at support after the breakout.
the reaction here could decide the next move. ^^ 👀
5
1
17
16.7k
·
--
BREAKING: Satoshi’s Labeled Stack Is Worth About $83 Billion After the August Rebound
The coins did not move. The dollar value did.
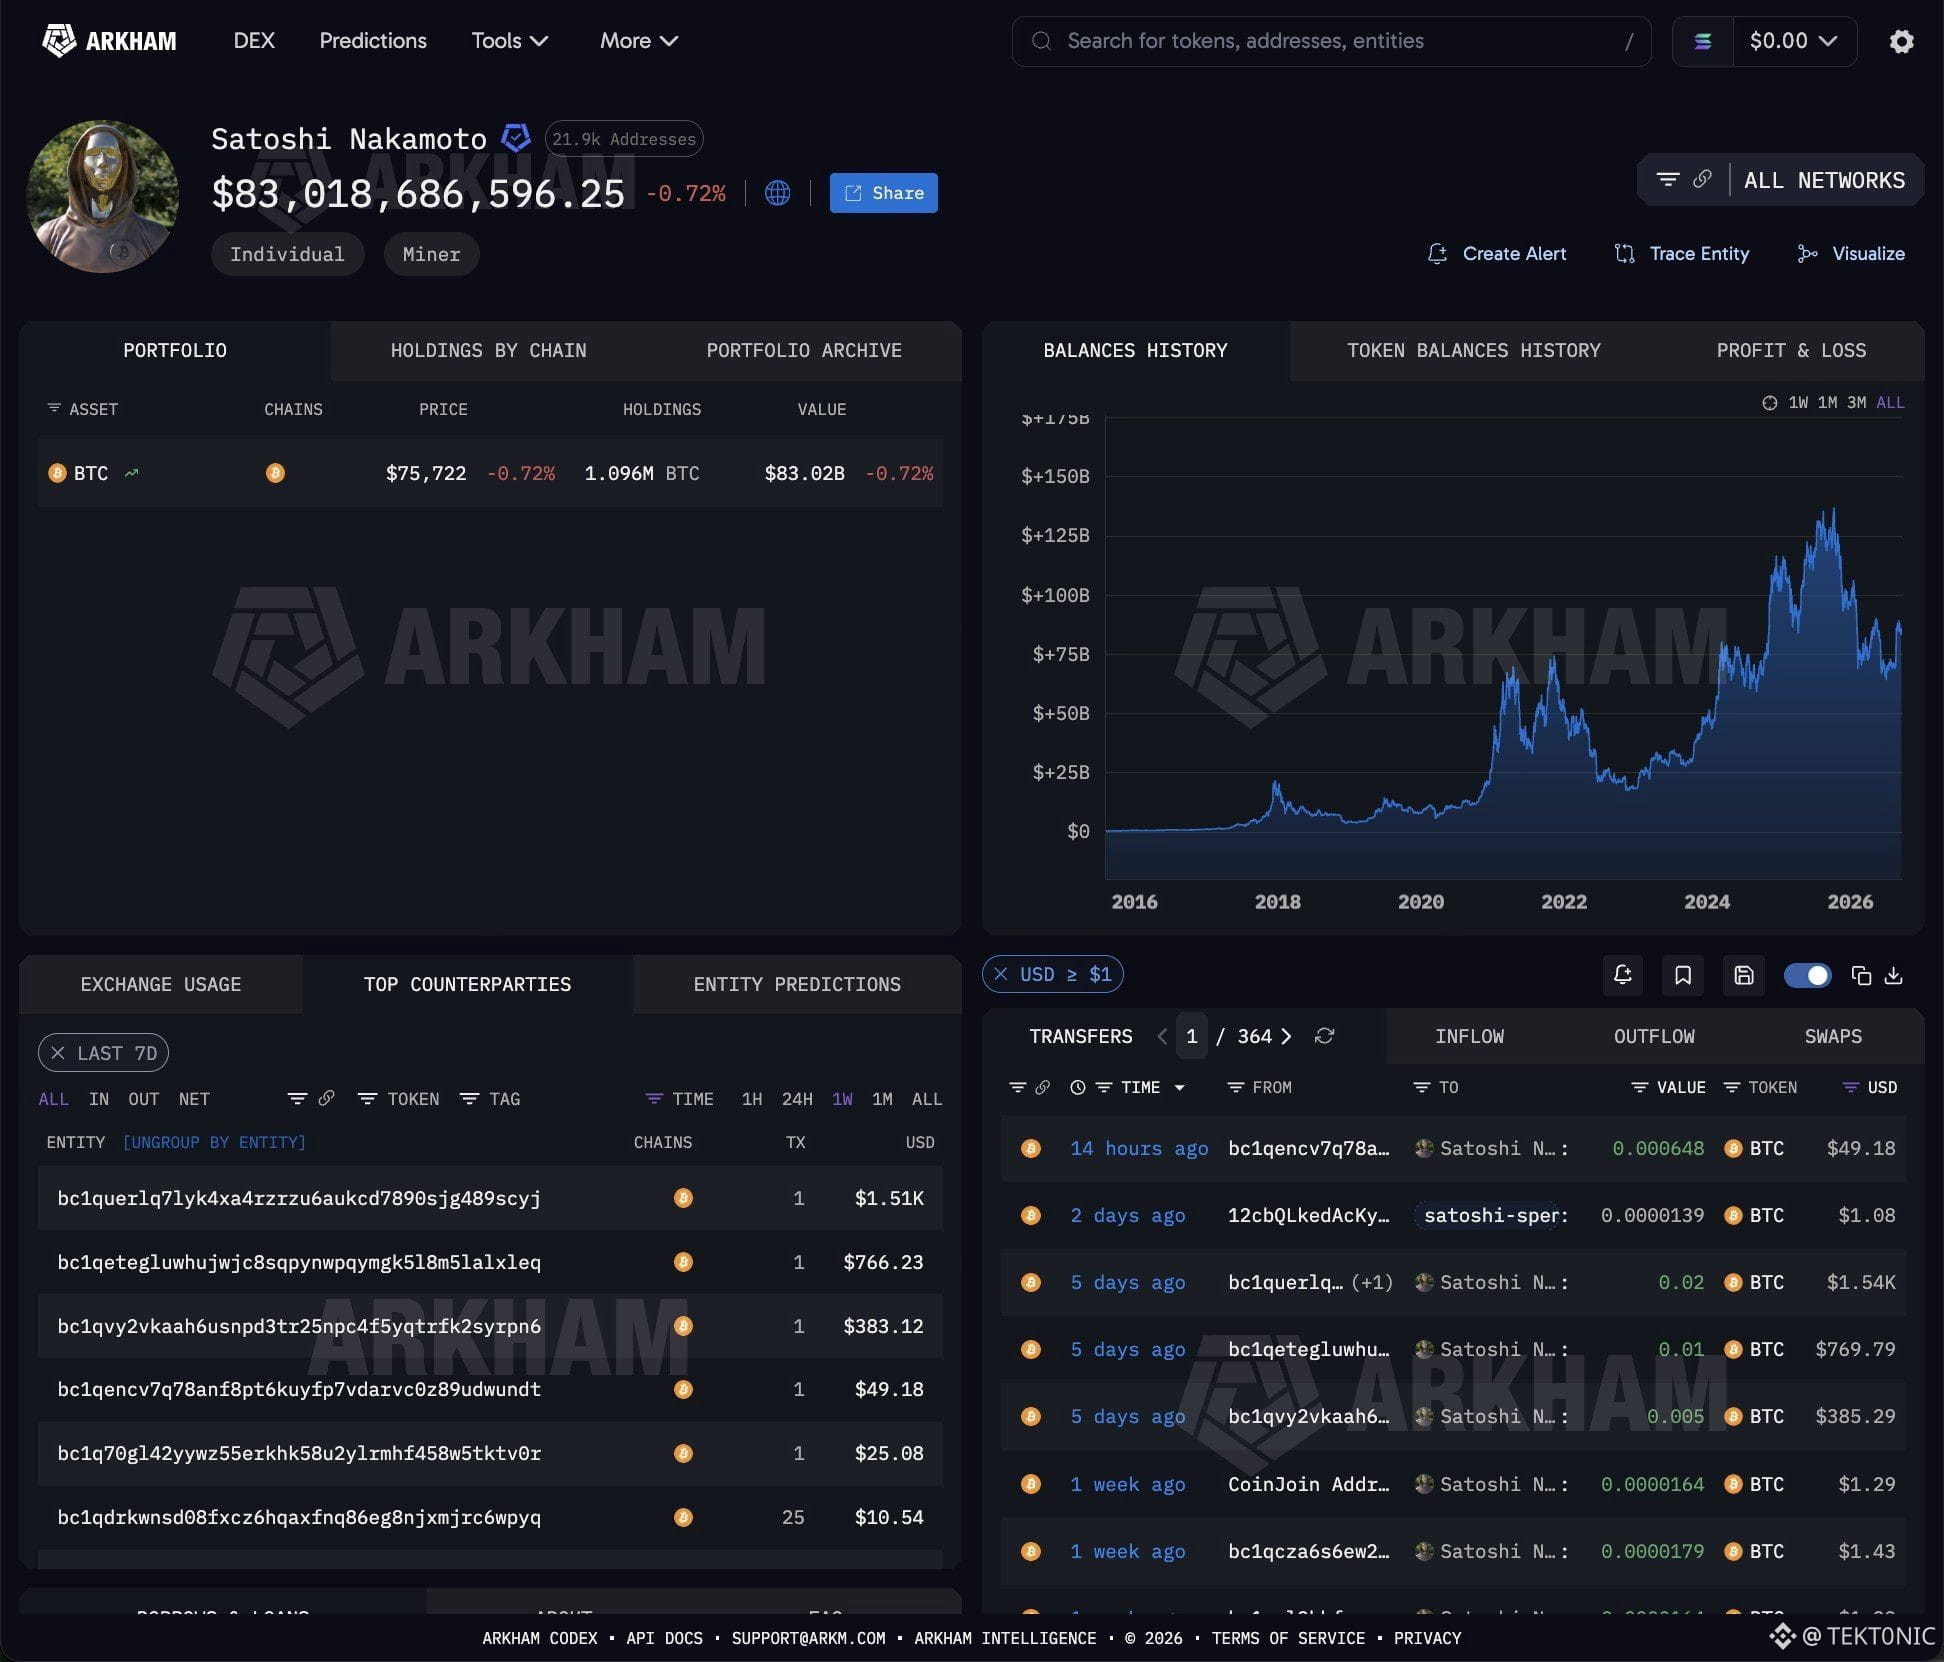
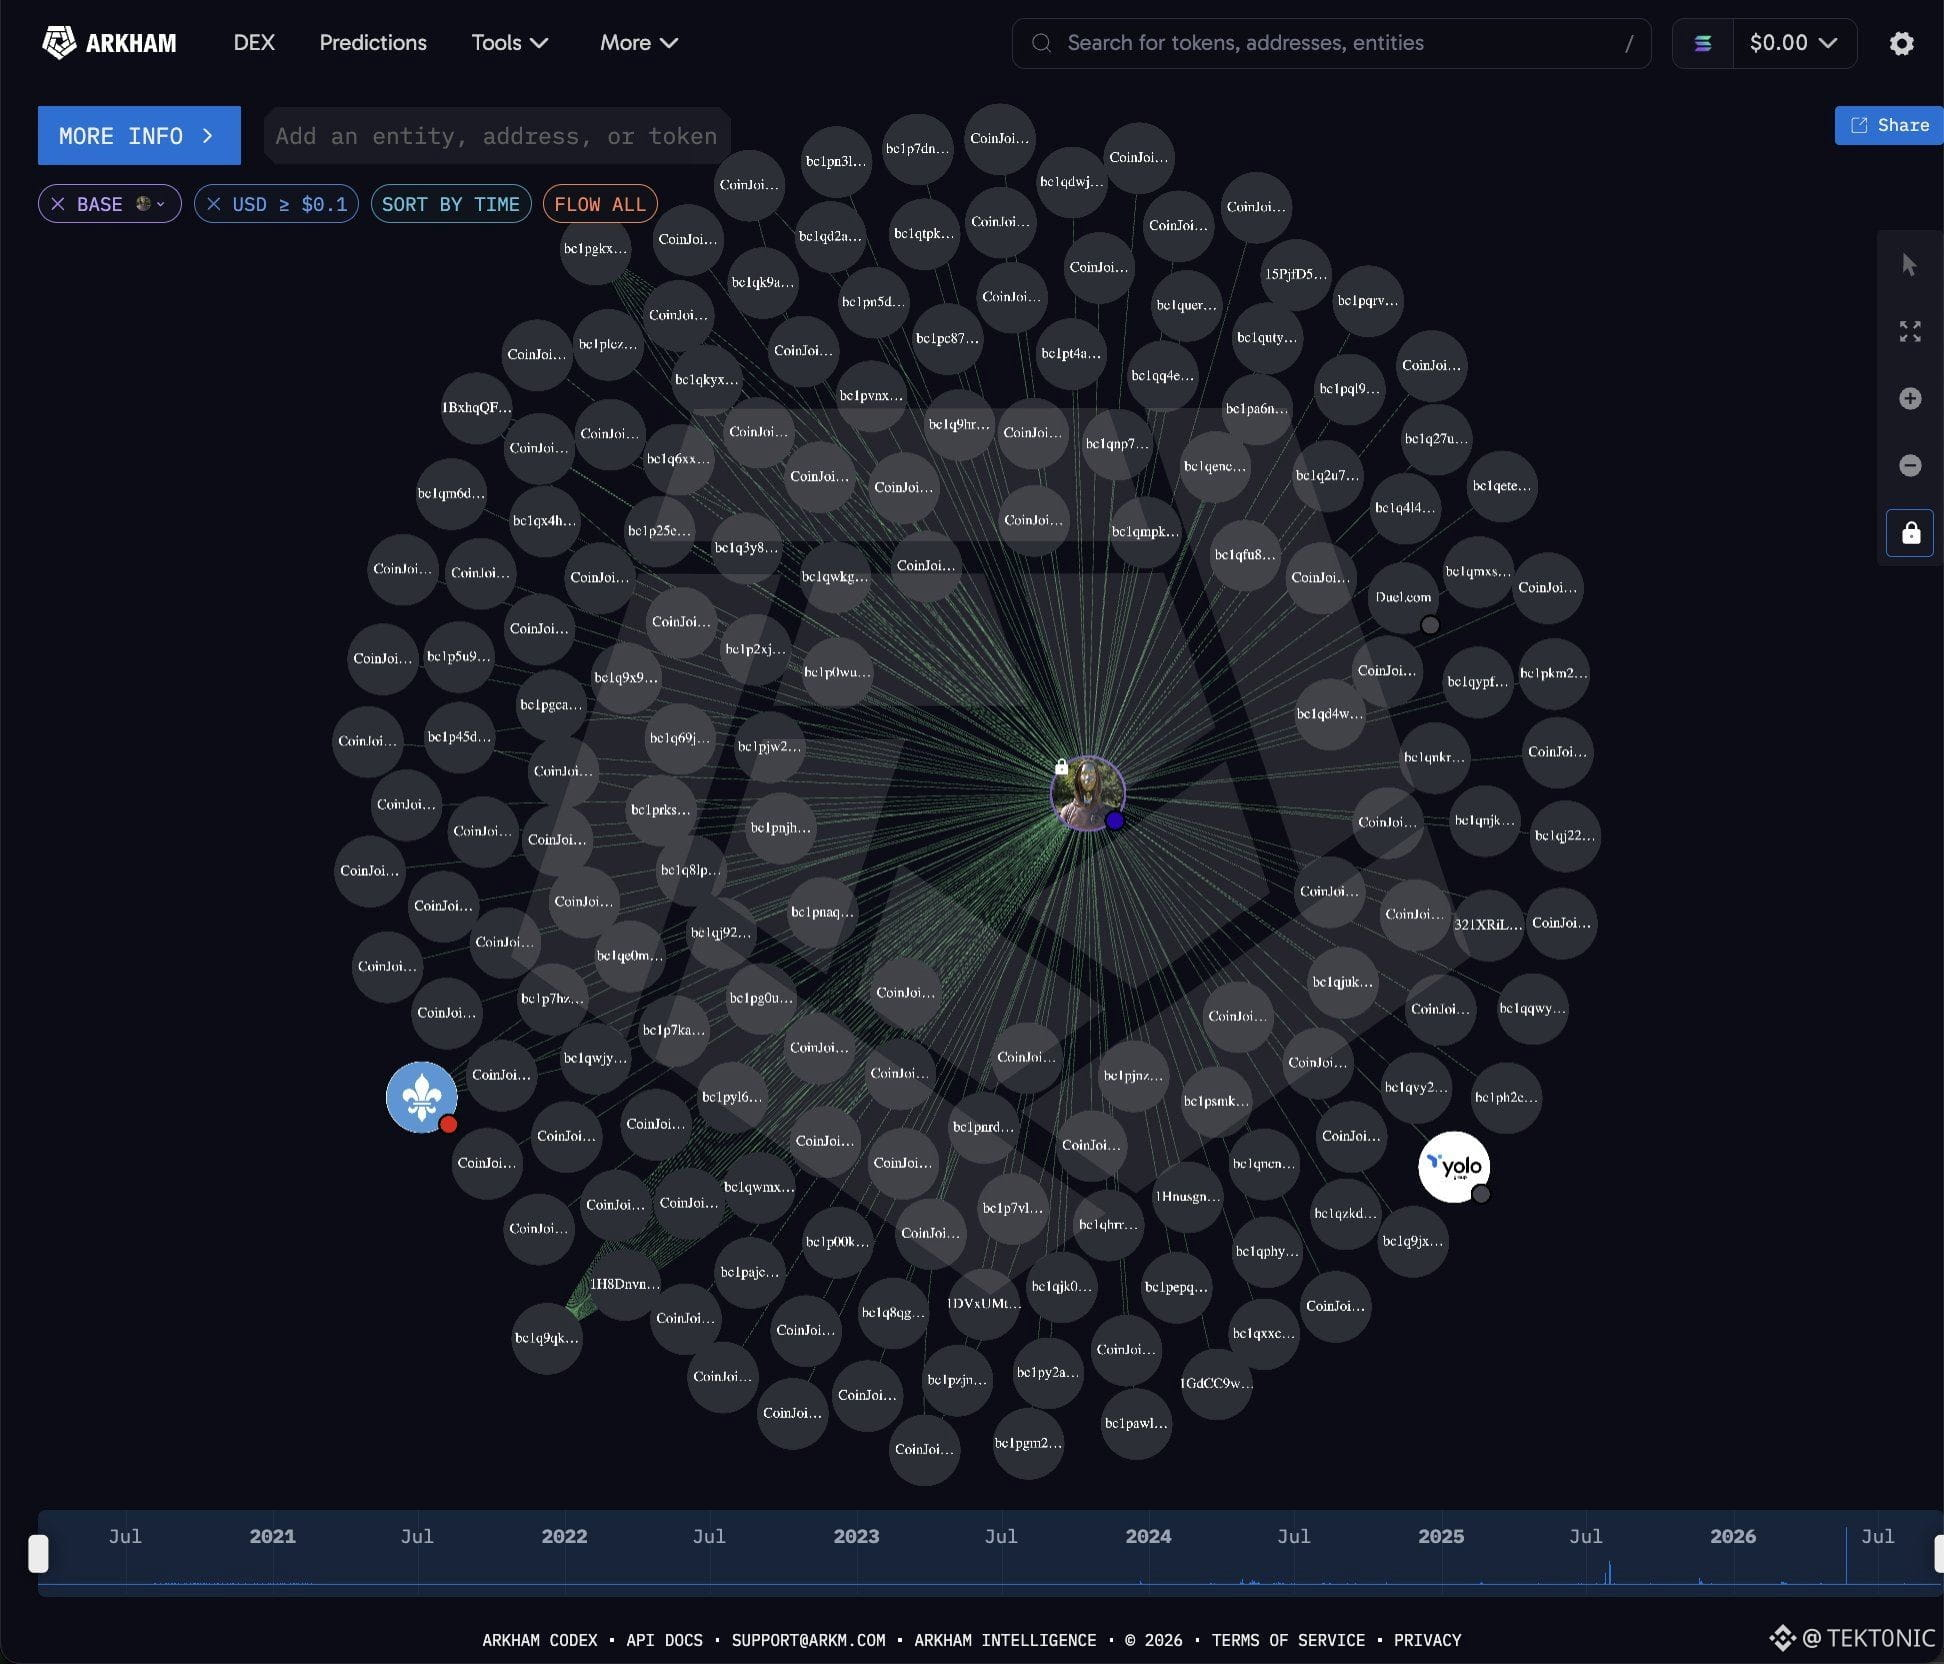
According to Arkham, the Satoshi Nakamoto entity is tagged at 1.096 million BTC, marked near $75,722, or about $83.02 billion. That is up roughly $12.4 billion over 30 days as Bitcoin gained about 17.5%. The entity covers 21.9k addresses. The original miner coins remain unspent.
Small inbound transfers on the dashboard are clustering noise, not Satoshi spending. The stack that matters has been dormant for years. Price did the work this month, not a sale.
Key Wallet Details:
> Holdings: 1.096 million BTC.
> Mark-to-market: about $83.0 billion.
> 30-day gain: about $12.4 billion, with Bitcoin up ~17.5%.
> Status: still unspent. No distribution from the core miner coins.
A $12 billion mark-to-market swing on a dormant stack is why supply from this cohort does not cap rallies. Those coins are not for sale. They also are not a bid. They simply sit.
Satoshi Entity: 1.096M BTC, ~$83B, +$12B in 30 Days — Still Unspent
BREAKING: Satoshi’s Labeled Stack Is Worth About $83 Billion After the August Rebound
The coins did not move. The dollar value did.
According to Arkham, the Satoshi Nakamoto entity is tagged at 1.096 million BTC, marked near $75,722, or about $83.02 billion. That is up roughly $12.4 billion over 30 days as Bitcoin gained about 17.5%. The entity covers 21.9k addresses. The original miner coins remain unspent.
Small inbound transfers on the dashboard are clustering noise, not Satoshi spending. The stack that matters has been dormant for years. Price did the work this month, not a sale.
Key Wallet Details:
> Holdings: 1.096 million BTC.
> Mark-to-market: about $83.0 billion.
> 30-day gain: about $12.4 billion, with Bitcoin up ~17.5%.
> Status: still unspent. No distribution from the core miner coins.
A $12 billion mark-to-market swing on a dormant stack is why supply from this cohort does not cap rallies. Those coins are not for sale. They also are not a bid. They simply sit.
Satoshi Entity: 1.096M BTC, ~$83B, +$12B in 30 Days — Still Unspent
The coins did not move. The dollar value did.
According to Arkham, the Satoshi Nakamoto entity is tagged at 1.096 million BTC, marked near $75,722, or about $83.02 billion. That is up roughly $12.4 billion over 30 days as Bitcoin gained about 17.5%. The entity covers 21.9k addresses. The original miner coins remain unspent.
Small inbound transfers on the dashboard are clustering noise, not Satoshi spending. The stack that matters has been dormant for years. Price did the work this month, not a sale.
Key Wallet Details:
> Holdings: 1.096 million BTC.
> Mark-to-market: about $83.0 billion.
> 30-day gain: about $12.4 billion, with Bitcoin up ~17.5%.
> Status: still unspent. No distribution from the core miner coins.
A $12 billion mark-to-market swing on a dormant stack is why supply from this cohort does not cap rallies. Those coins are not for sale. They also are not a bid. They simply sit.
Satoshi Entity: 1.096M BTC, ~$83B, +$12B in 30 Days — Still Unspent
2
396
·
--
Проверено
BREAKING: Brent Is Pushing Toward $108 After Saudi Arabia Shut Its East-West Pipeline
The main overland route that skips the Strait of Hormuz is offline.
According to market reports, Saudi Arabia halted the East-West pipeline after attacks on the system. That line moves crude from eastern fields to the Red Sea terminal at Yanbu and has been the kingdom’s main way around Hormuz. Brent last traded near $108.23. WTI was near $103.20. Reuters notes the outage could threaten up to about 4% of global supply if export stocks run down before the line restarts.
Key Details:
> Brent: about $108 a barrel.
> The East-West pipeline is the Hormuz bypass to Yanbu on the Red Sea.
> Saudi officials called the shutdown a precaution. No restart date has been given.
> Traders say Yanbu-area stocks may cover only days of exports if the line stays down.
Higher oil feeds the inflation problem the Fed is already staring at. That is the crypto link: a $108 Brent print into a rate decision week usually supports yields and the dollar and weighs on Bitcoin. The energy shock is the story. $108 is the price of that shock until the pipeline is back.
Brent Near $108 as Saudi East-West Pipeline Stays Shut
BREAKING: Brent Is Pushing Toward $108 After Saudi Arabia Shut Its East-West Pipeline
The main overland route that skips the Strait of Hormuz is offline.
According to market reports, Saudi Arabia halted the East-West pipeline after attacks on the system. That line moves crude from eastern fields to the Red Sea terminal at Yanbu and has been the kingdom’s main way around Hormuz. Brent last traded near $108.23. WTI was near $103.20. Reuters notes the outage could threaten up to about 4% of global supply if export stocks run down before the line restarts.
Key Details:
> Brent: about $108 a barrel.
> The East-West pipeline is the Hormuz bypass to Yanbu on the Red Sea.
> Saudi officials called the shutdown a precaution. No restart date has been given.
> Traders say Yanbu-area stocks may cover only days of exports if the line stays down.
Higher oil feeds the inflation problem the Fed is already staring at. That is the crypto link: a $108 Brent print into a rate decision week usually supports yields and the dollar and weighs on Bitcoin. The energy shock is the story. $108 is the price of that shock until the pipeline is back.
Brent Near $108 as Saudi East-West Pipeline Stays Shut
The main overland route that skips the Strait of Hormuz is offline.
According to market reports, Saudi Arabia halted the East-West pipeline after attacks on the system. That line moves crude from eastern fields to the Red Sea terminal at Yanbu and has been the kingdom’s main way around Hormuz. Brent last traded near $108.23. WTI was near $103.20. Reuters notes the outage could threaten up to about 4% of global supply if export stocks run down before the line restarts.
Key Details:
> Brent: about $108 a barrel.
> The East-West pipeline is the Hormuz bypass to Yanbu on the Red Sea.
> Saudi officials called the shutdown a precaution. No restart date has been given.
> Traders say Yanbu-area stocks may cover only days of exports if the line stays down.
Higher oil feeds the inflation problem the Fed is already staring at. That is the crypto link: a $108 Brent print into a rate decision week usually supports yields and the dollar and weighs on Bitcoin. The energy shock is the story. $108 is the price of that shock until the pipeline is back.
Brent Near $108 as Saudi East-West Pipeline Stays Shut

2
447
·
--
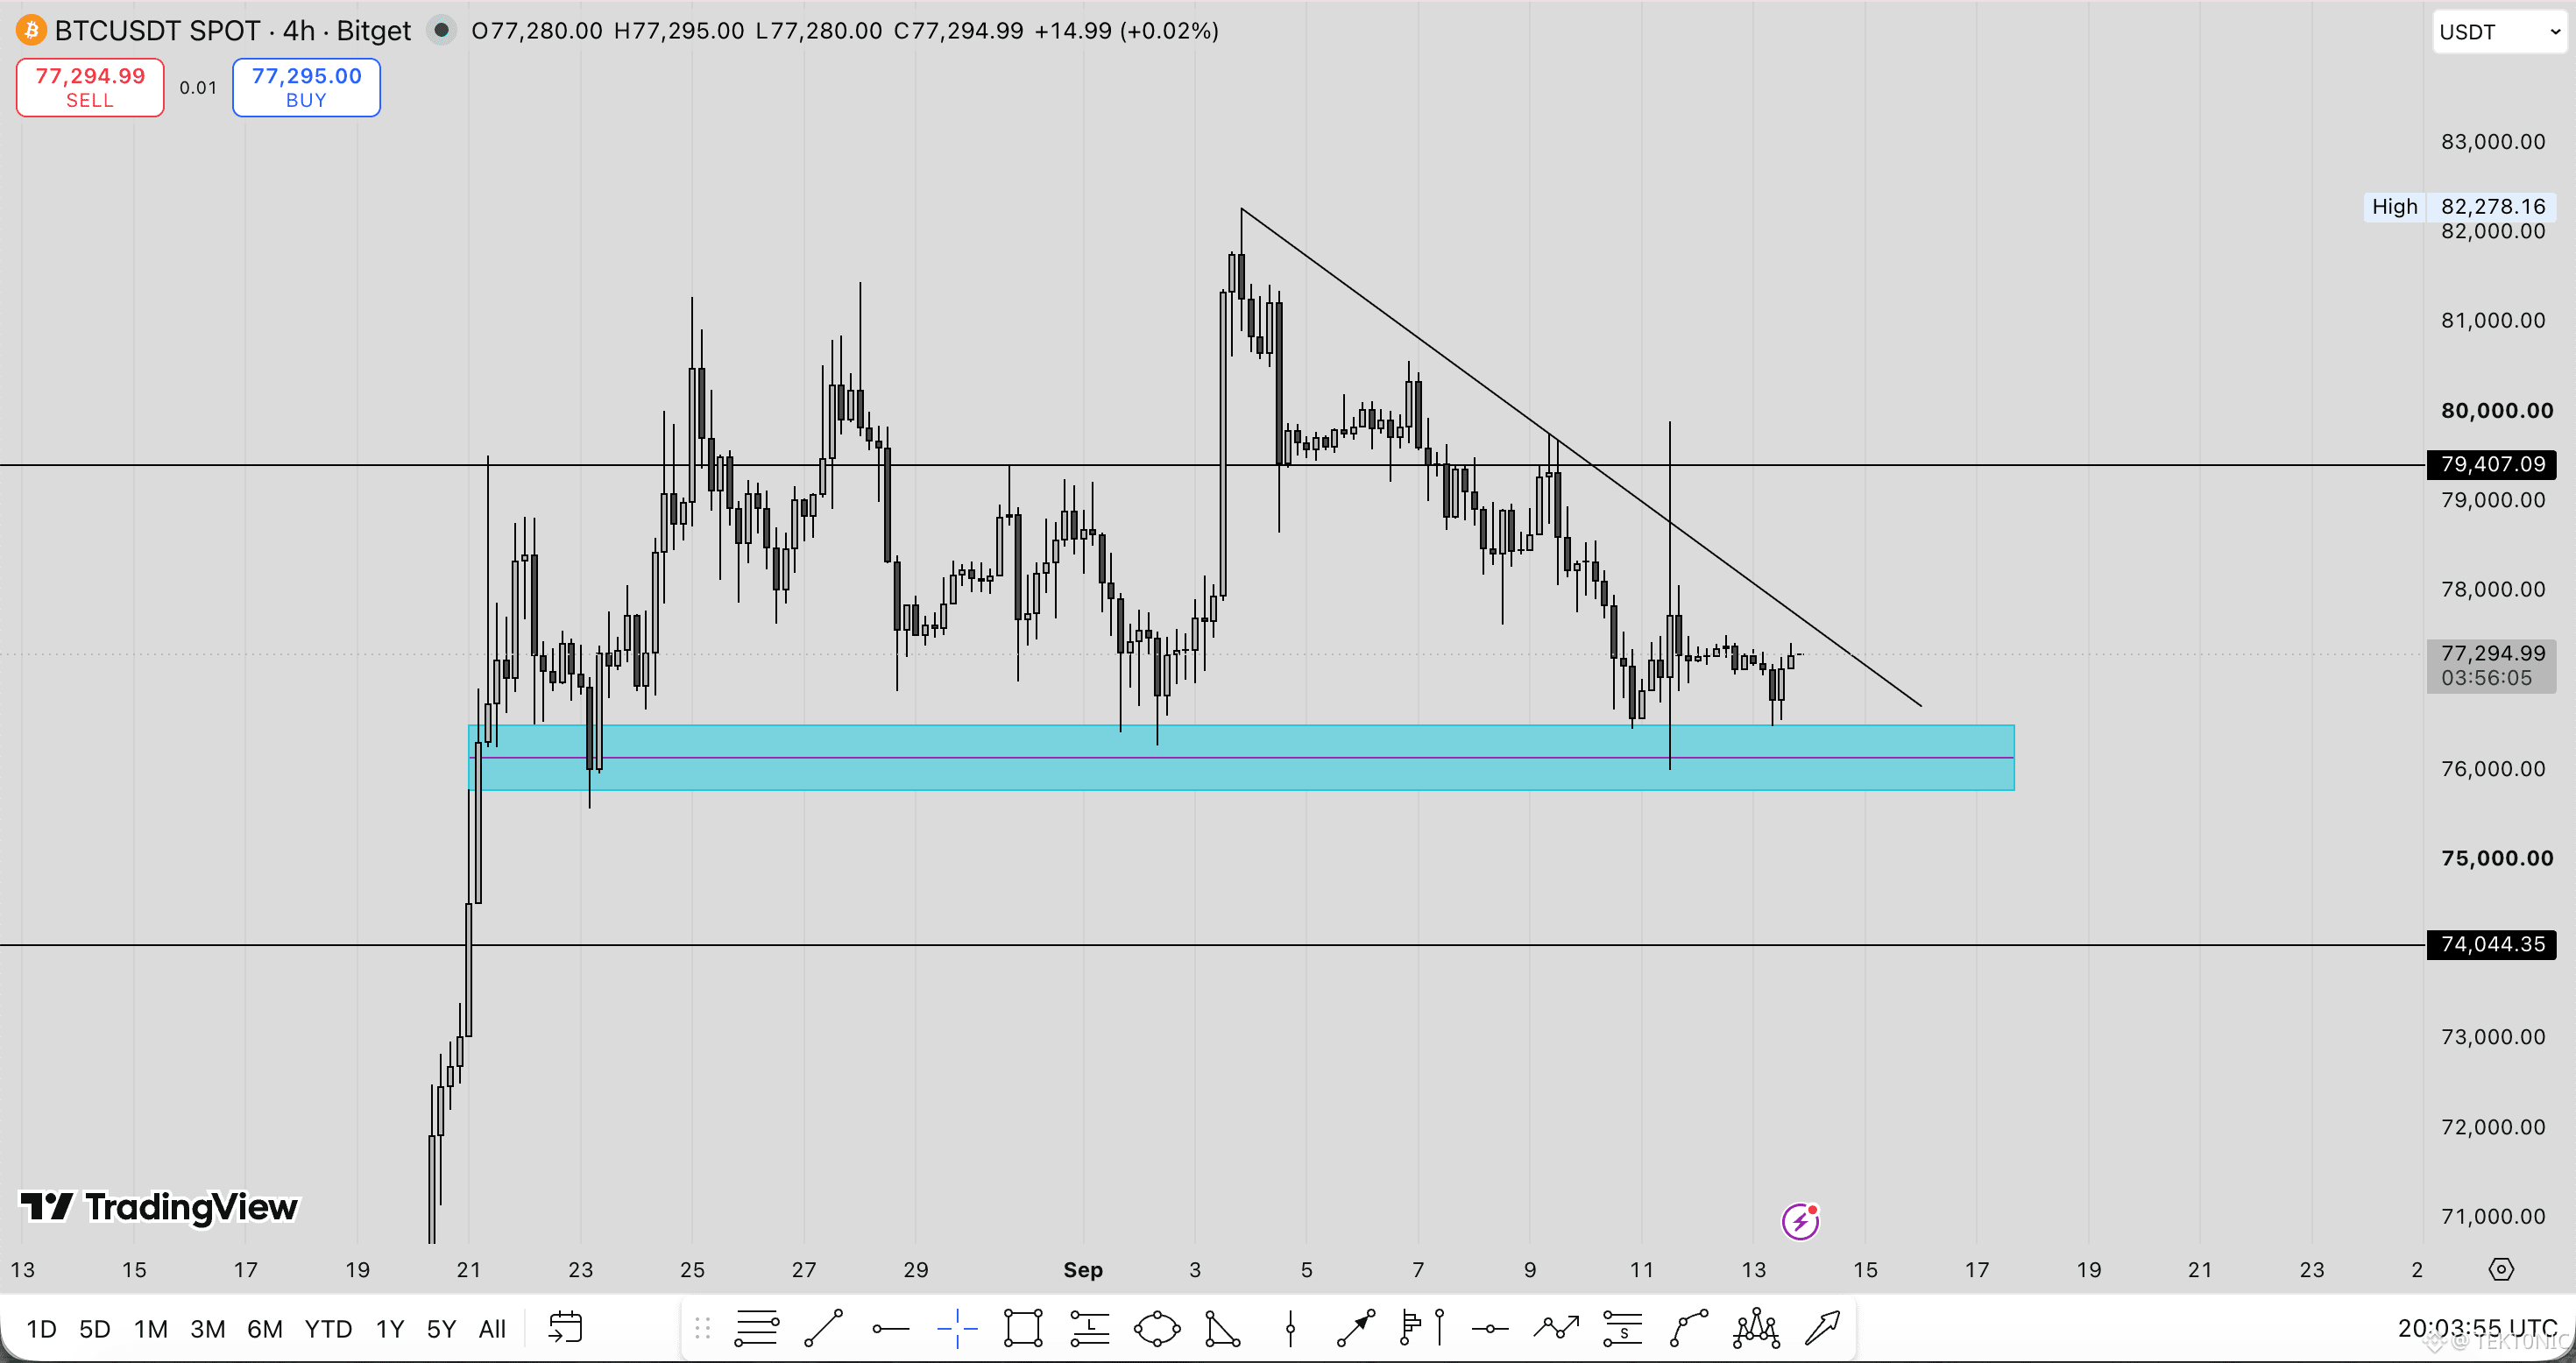
BTC is currently around $77,295 and this structure is worth watching.
price has been making lower highs under the descending trendline while holding the $76,000 - $76,500 demand area.
i’m watching for a clear breakout from this structure.
if BTC breaks above the trendline and reclaims $79,407:
i’ll be looking for a long entry on the retest.
if price loses the $76,000 area:
i’ll be watching for a short entry after a clean retest.
for now, BTC is still compressed between resistance and demand.
waiting for the breakout before taking a trade. ^^
BTC is currently around $77,295 and this structure is worth watching.
price has been making lower highs under the descending trendline while holding the $76,000 - $76,500 demand area.
i’m watching for a clear breakout from this structure.
if BTC breaks above the trendline and reclaims $79,407:
i’ll be looking for a long entry on the retest.
if price loses the $76,000 area:
i’ll be watching for a short entry after a clean retest.
for now, BTC is still compressed between resistance and demand.
waiting for the breakout before taking a trade. ^^
price has been making lower highs under the descending trendline while holding the $76,000 - $76,500 demand area.
i’m watching for a clear breakout from this structure.
if BTC breaks above the trendline and reclaims $79,407:
i’ll be looking for a long entry on the retest.
if price loses the $76,000 area:
i’ll be watching for a short entry after a clean retest.
for now, BTC is still compressed between resistance and demand.
waiting for the breakout before taking a trade. ^^
2
2
1.7k
·
--
Bitcoin Spot CVD Is Still Falling While Price Holds the Mid-$76,000s
Spot sellers have been the consistent bid — on the offer.
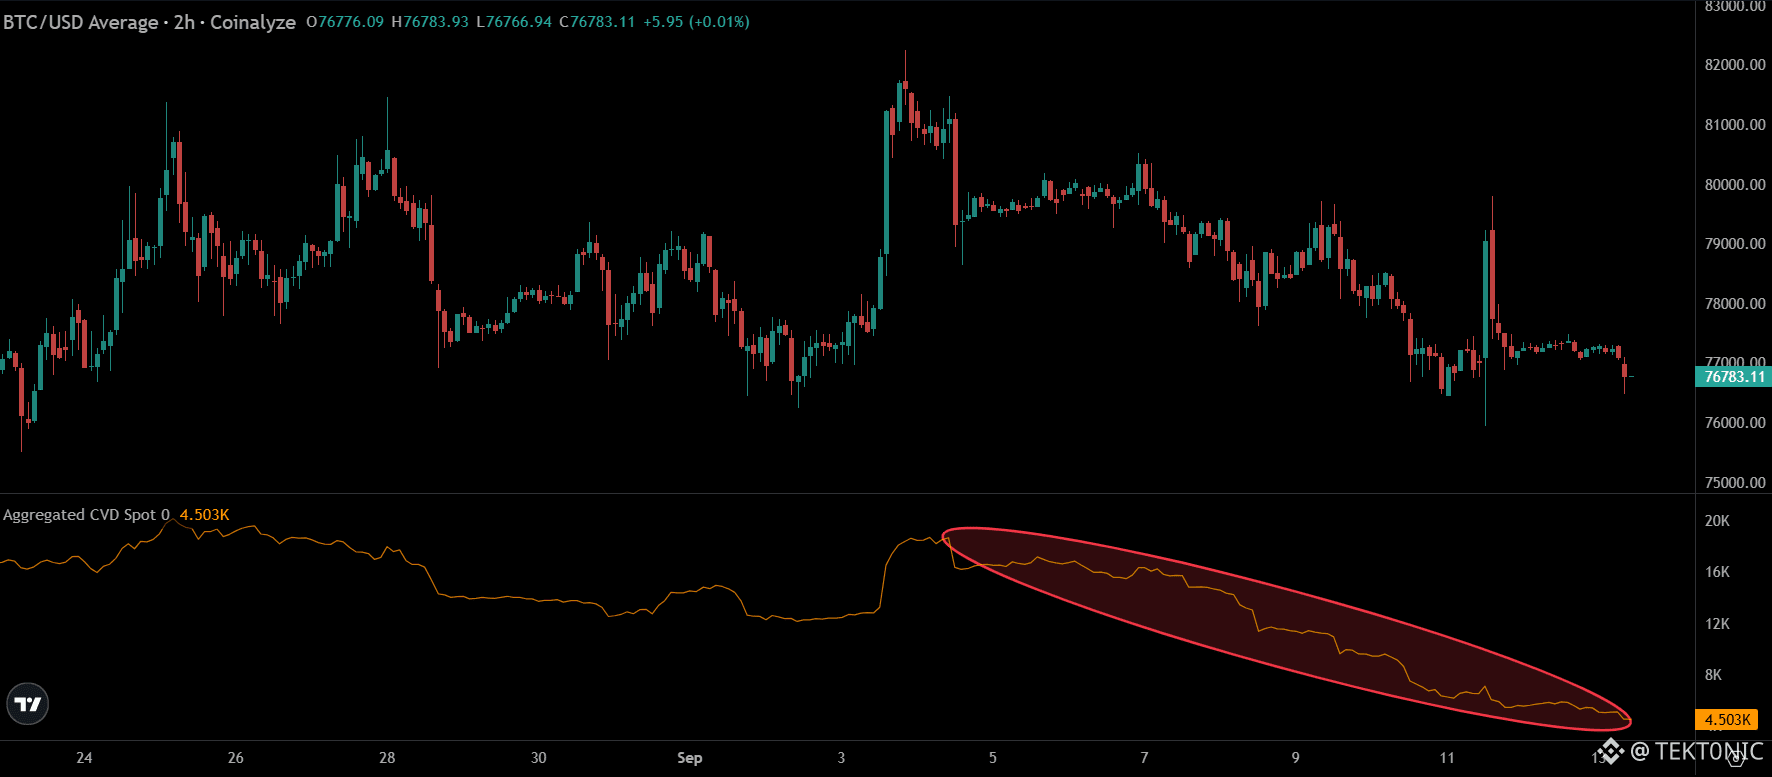
According to the Coinalyze 2-hour chart, BTC is about $76,783. Aggregated spot CVD has slid from the mid-teens after the September 3 spike down to about 4.5K. Price chopped lower from the $82,000 area while that yellow line kept making lower lows.
Key Details:
> Bitcoin: about $76,783 on the 2-hour average.
> Spot CVD: 4.503K and still declining inside the marked downtrend.
> CVD falling with price means market sells are beating market buys on spot venues.
> The ETH read next to this: that dip looks more like leverage coming off than the same spot dump, which is why Ether can bounce harder if risk returns.
A bounce that starts with leverage covering usually lifts Ether first. A bounce that needs fresh spot demand has to show up as CVD turning up, not just a green candle. Until Bitcoin spot CVD stops falling, $80,000 is still a sell zone on this view.
Bitcoin Spot CVD Down to 4.5K at $76,800 — Spot Still Selling
Do you buy Ether for the bounce because its dip was leverage, or do you wait for Bitcoin spot CVD to turn up first?
Bitcoin Spot CVD Is Still Falling While Price Holds the Mid-$76,000s
Spot sellers have been the consistent bid — on the offer.
According to the Coinalyze 2-hour chart, BTC is about $76,783. Aggregated spot CVD has slid from the mid-teens after the September 3 spike down to about 4.5K. Price chopped lower from the $82,000 area while that yellow line kept making lower lows.
Key Details:
> Bitcoin: about $76,783 on the 2-hour average.
> Spot CVD: 4.503K and still declining inside the marked downtrend.
> CVD falling with price means market sells are beating market buys on spot venues.
> The ETH read next to this: that dip looks more like leverage coming off than the same spot dump, which is why Ether can bounce harder if risk returns.
A bounce that starts with leverage covering usually lifts Ether first. A bounce that needs fresh spot demand has to show up as CVD turning up, not just a green candle. Until Bitcoin spot CVD stops falling, $80,000 is still a sell zone on this view.
Bitcoin Spot CVD Down to 4.5K at $76,800 — Spot Still Selling
Do you buy Ether for the bounce because its dip was leverage, or do you wait for Bitcoin spot CVD to turn up first?
Spot sellers have been the consistent bid — on the offer.
According to the Coinalyze 2-hour chart, BTC is about $76,783. Aggregated spot CVD has slid from the mid-teens after the September 3 spike down to about 4.5K. Price chopped lower from the $82,000 area while that yellow line kept making lower lows.
Key Details:
> Bitcoin: about $76,783 on the 2-hour average.
> Spot CVD: 4.503K and still declining inside the marked downtrend.
> CVD falling with price means market sells are beating market buys on spot venues.
> The ETH read next to this: that dip looks more like leverage coming off than the same spot dump, which is why Ether can bounce harder if risk returns.
A bounce that starts with leverage covering usually lifts Ether first. A bounce that needs fresh spot demand has to show up as CVD turning up, not just a green candle. Until Bitcoin spot CVD stops falling, $80,000 is still a sell zone on this view.
Bitcoin Spot CVD Down to 4.5K at $76,800 — Spot Still Selling
Do you buy Ether for the bounce because its dip was leverage, or do you wait for Bitcoin spot CVD to turn up first?
1
2
199
·
--
BREAKING: Large-Holder Bitcoin Supply Has Been Rebuilding Into the $77,000 Area
The orange line on this overlay is the accumulation side of the tape. Price is the black line.
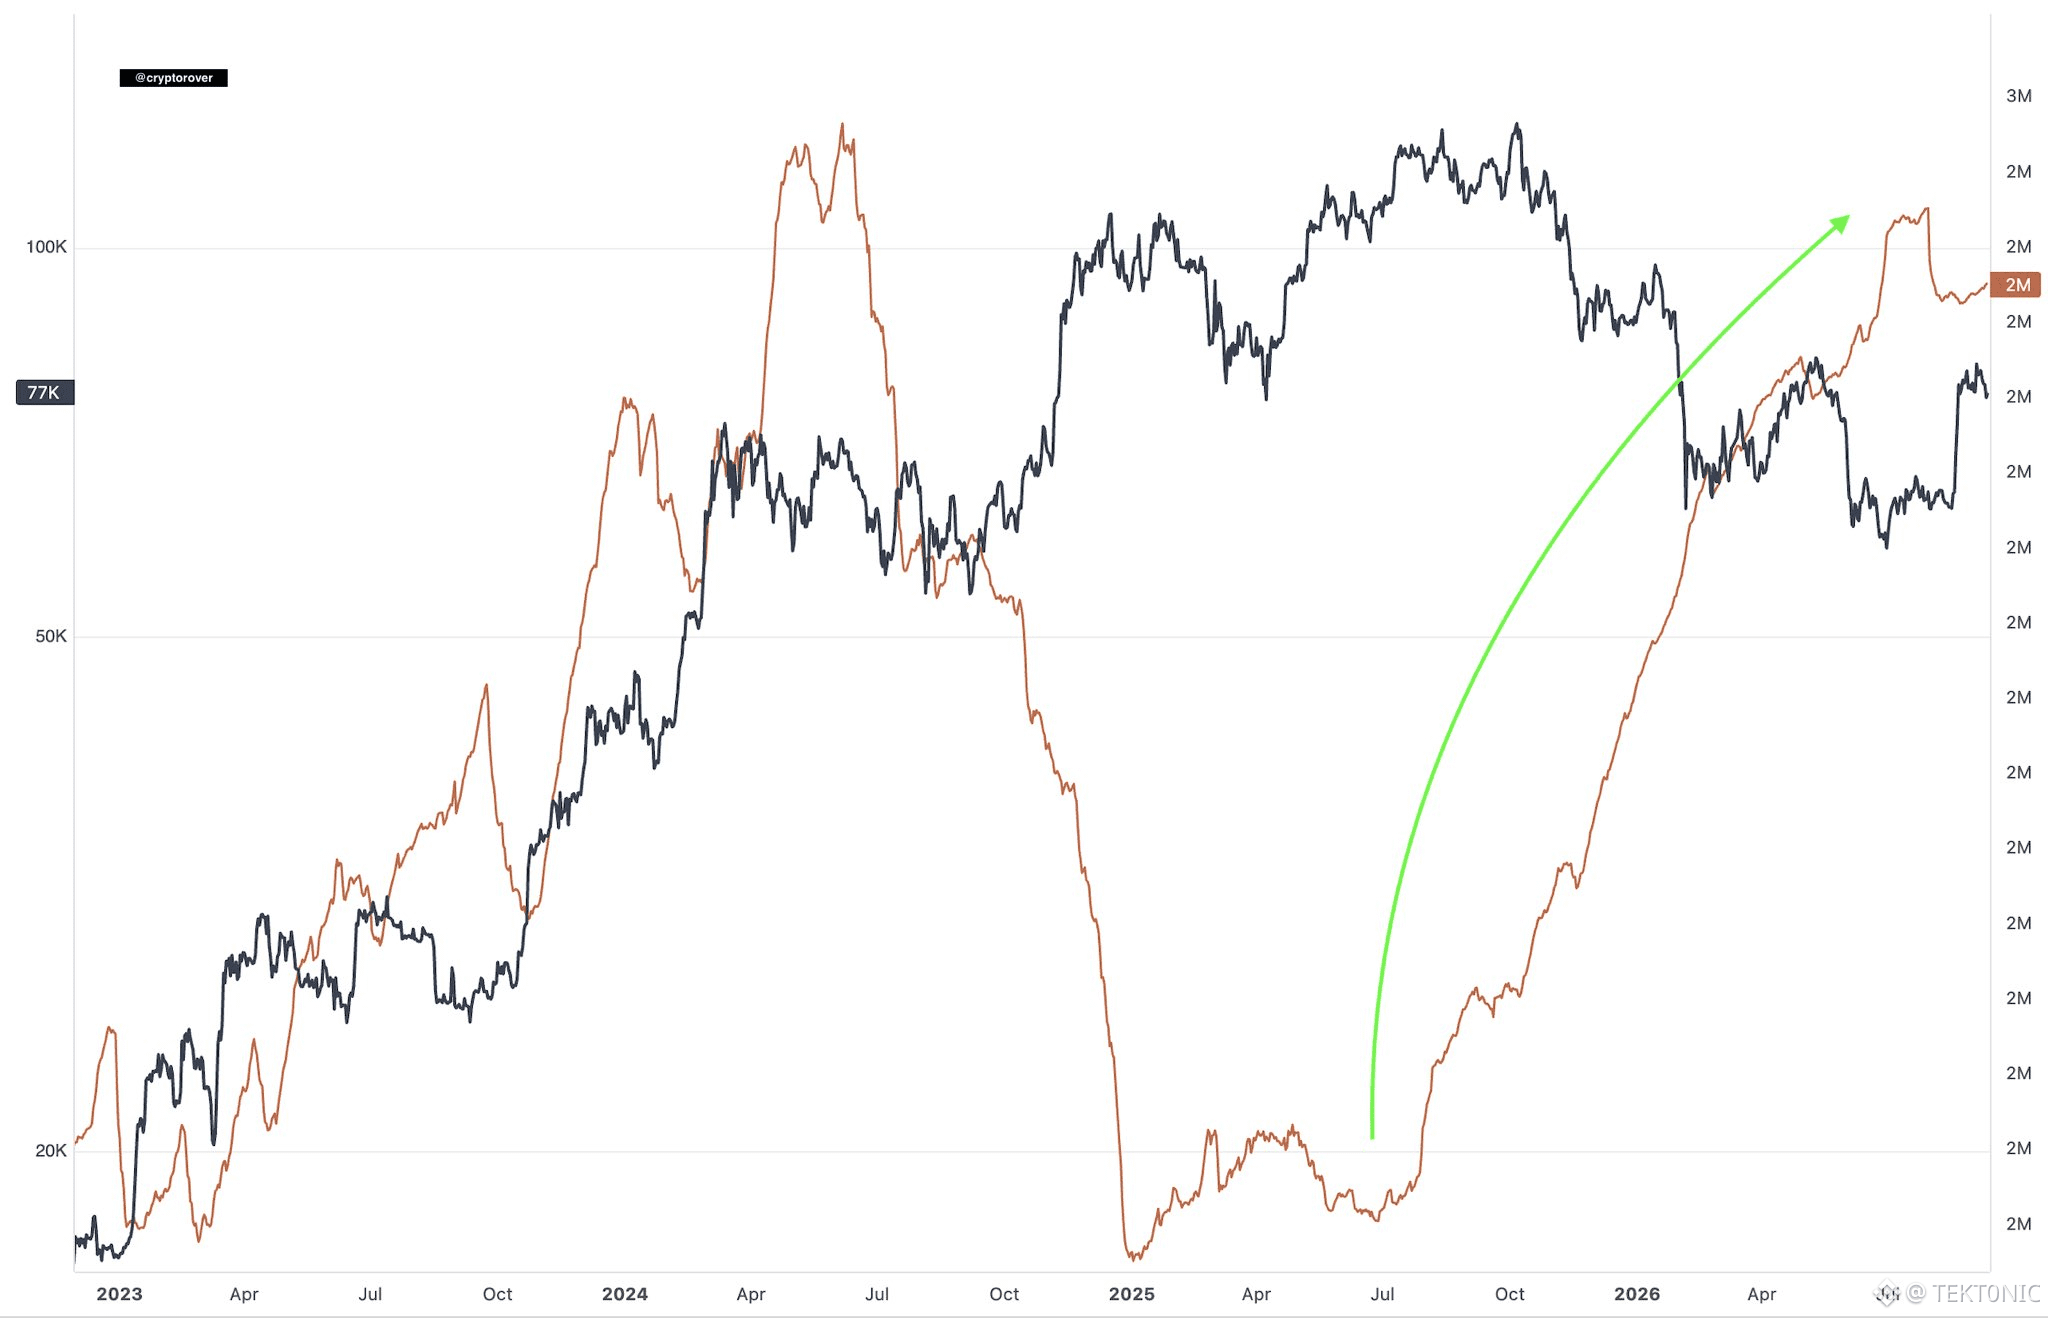
According to the chart, Bitcoin is near $77,000. The second series — the whale/large-holder cohort on the right-hand scale — collapsed in late 2024, then turned up through 2025 and 2026 and is back near the 2 million mark. That recovery is what the green arrow is marking.
Key Details:
> Bitcoin price on this view: about $77,000, still below the $100,000 handle and the $126,000 high.
> The orange cohort fell hard, then spent more than a year grinding higher.
> The latest reading is back around 2 million on that scale.
> Price and the cohort are no longer moving in lockstep: holdings rebuilt while price chopped.
A rising large-holder line into a $77,000 base is constructive. It is not the same thing as a breakout. Whales can add for months and still sell into $83,000. Confirmation remains a hold of $80,000 and a close through $82,000–$83,000.
Whale-Scale Bitcoin Holdings Back Near 2M While Price Sits at $77K
BREAKING: Large-Holder Bitcoin Supply Has Been Rebuilding Into the $77,000 Area
The orange line on this overlay is the accumulation side of the tape. Price is the black line.
According to the chart, Bitcoin is near $77,000. The second series — the whale/large-holder cohort on the right-hand scale — collapsed in late 2024, then turned up through 2025 and 2026 and is back near the 2 million mark. That recovery is what the green arrow is marking.
Key Details:
> Bitcoin price on this view: about $77,000, still below the $100,000 handle and the $126,000 high.
> The orange cohort fell hard, then spent more than a year grinding higher.
> The latest reading is back around 2 million on that scale.
> Price and the cohort are no longer moving in lockstep: holdings rebuilt while price chopped.
A rising large-holder line into a $77,000 base is constructive. It is not the same thing as a breakout. Whales can add for months and still sell into $83,000. Confirmation remains a hold of $80,000 and a close through $82,000–$83,000.
Whale-Scale Bitcoin Holdings Back Near 2M While Price Sits at $77K
The orange line on this overlay is the accumulation side of the tape. Price is the black line.
According to the chart, Bitcoin is near $77,000. The second series — the whale/large-holder cohort on the right-hand scale — collapsed in late 2024, then turned up through 2025 and 2026 and is back near the 2 million mark. That recovery is what the green arrow is marking.
Key Details:
> Bitcoin price on this view: about $77,000, still below the $100,000 handle and the $126,000 high.
> The orange cohort fell hard, then spent more than a year grinding higher.
> The latest reading is back around 2 million on that scale.
> Price and the cohort are no longer moving in lockstep: holdings rebuilt while price chopped.
A rising large-holder line into a $77,000 base is constructive. It is not the same thing as a breakout. Whales can add for months and still sell into $83,000. Confirmation remains a hold of $80,000 and a close through $82,000–$83,000.
Whale-Scale Bitcoin Holdings Back Near 2M While Price Sits at $77K
1
197
·
--
HUGE: RWA capital is moving across more chains.
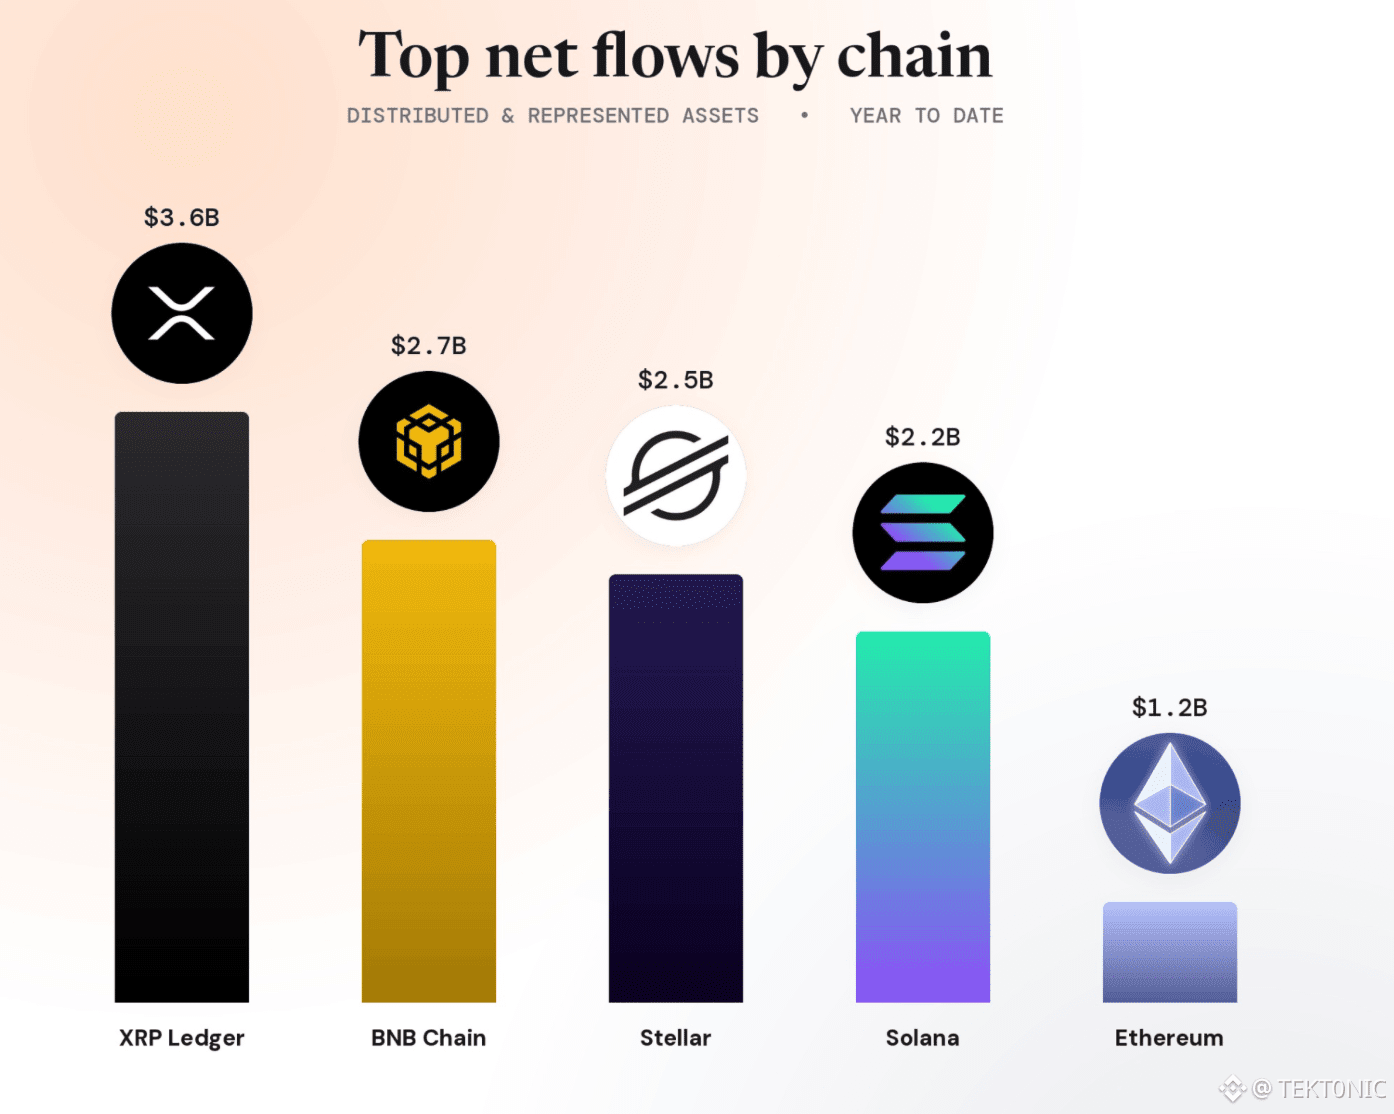
year to date, the XRP Ledger has attracted around $3.6b in net RWA flows, leading all major chains.
here’s how the top 5 look:
XRP Ledger — $3.6b
BNB Chain — $2.7b
Stellar — $2.5b
Solana — $2.2b
Ethereum — $1.2b
and the growth isn’t limited to one type of asset.
XRPL’s recent inflows have been driven heavily by tokenized commodities and asset-backed credit, while Stellar has crossed $3b in total RWA value with Treasuries, money-market funds, credit and gold all represented on the network.
ethereum still has the largest overall RWA base, but the flow data shows capital is spreading across other ecosystems.
tokenization is becoming a multi-chain market.
and these numbers are starting to show it.
HUGE: RWA capital is moving across more chains.
year to date, the XRP Ledger has attracted around $3.6b in net RWA flows, leading all major chains.
here’s how the top 5 look:
XRP Ledger — $3.6b
BNB Chain — $2.7b
Stellar — $2.5b
Solana — $2.2b
Ethereum — $1.2b
and the growth isn’t limited to one type of asset.
XRPL’s recent inflows have been driven heavily by tokenized commodities and asset-backed credit, while Stellar has crossed $3b in total RWA value with Treasuries, money-market funds, credit and gold all represented on the network.
ethereum still has the largest overall RWA base, but the flow data shows capital is spreading across other ecosystems.
tokenization is becoming a multi-chain market.
and these numbers are starting to show it.
year to date, the XRP Ledger has attracted around $3.6b in net RWA flows, leading all major chains.
here’s how the top 5 look:
XRP Ledger — $3.6b
BNB Chain — $2.7b
Stellar — $2.5b
Solana — $2.2b
Ethereum — $1.2b
and the growth isn’t limited to one type of asset.
XRPL’s recent inflows have been driven heavily by tokenized commodities and asset-backed credit, while Stellar has crossed $3b in total RWA value with Treasuries, money-market funds, credit and gold all represented on the network.
ethereum still has the largest overall RWA base, but the flow data shows capital is spreading across other ecosystems.
tokenization is becoming a multi-chain market.
and these numbers are starting to show it.
2
335
·
--
Проверено
🚨 BREAKING: the Houthis now sit on the rock that splits Bab el-Mandeb.
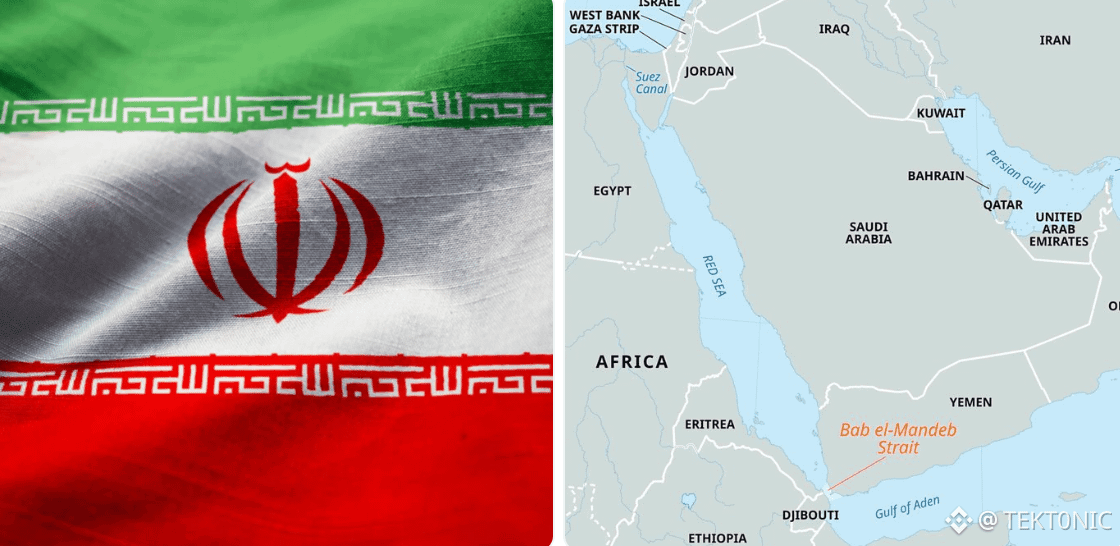
Perim Island, also called Mayun, fell after Yemeni government forces pulled off. Mocha and Dhubab went in the same two-day push. Perim divides the strait into its two shipping lanes, which is why the island matters more than another coastal town.
Q2 flows through Bab el-Mandeb averaged 8.1 million barrels a day, per the EIA, about 8% of global supply. that volume had already jumped after Hormuz tightened and more Gulf crude was sent to Yanbu for the Red Sea route. Kpler had crossings drop from 30 to 15 on Friday.
Hormuz traffic is already crushed. the Saudi East-West line that exists to bypass it was hit and shut in the same window. Brent has been trading above $100.
two oil chokepoints are now under pressure at once. cargo that leaves one gate still has to clear the other.
the catch: seizing Perim is not the same as closing the strait. ships are still moving, just fewer of them. the price is pricing disruption risk, not a confirmed zero-flow print.
🚨 BREAKING: the Houthis now sit on the rock that splits Bab el-Mandeb.
Perim Island, also called Mayun, fell after Yemeni government forces pulled off. Mocha and Dhubab went in the same two-day push. Perim divides the strait into its two shipping lanes, which is why the island matters more than another coastal town.
Q2 flows through Bab el-Mandeb averaged 8.1 million barrels a day, per the EIA, about 8% of global supply. that volume had already jumped after Hormuz tightened and more Gulf crude was sent to Yanbu for the Red Sea route. Kpler had crossings drop from 30 to 15 on Friday.
Hormuz traffic is already crushed. the Saudi East-West line that exists to bypass it was hit and shut in the same window. Brent has been trading above $100.
two oil chokepoints are now under pressure at once. cargo that leaves one gate still has to clear the other.
the catch: seizing Perim is not the same as closing the strait. ships are still moving, just fewer of them. the price is pricing disruption risk, not a confirmed zero-flow print.
Perim Island, also called Mayun, fell after Yemeni government forces pulled off. Mocha and Dhubab went in the same two-day push. Perim divides the strait into its two shipping lanes, which is why the island matters more than another coastal town.
Q2 flows through Bab el-Mandeb averaged 8.1 million barrels a day, per the EIA, about 8% of global supply. that volume had already jumped after Hormuz tightened and more Gulf crude was sent to Yanbu for the Red Sea route. Kpler had crossings drop from 30 to 15 on Friday.
Hormuz traffic is already crushed. the Saudi East-West line that exists to bypass it was hit and shut in the same window. Brent has been trading above $100.
two oil chokepoints are now under pressure at once. cargo that leaves one gate still has to clear the other.
the catch: seizing Perim is not the same as closing the strait. ships are still moving, just fewer of them. the price is pricing disruption risk, not a confirmed zero-flow print.
3
1
17
17.5k
·
--
Проверено
🚨 BREAKING: Strategy Did Not Touch Its Bitcoin This Week
Michael Saylor’s company still holds 845,050 $BTC. There were no buys and no sells in the past week. The stack is unchanged after last month’s $370 million purchase of 4,603 BTC, which ended a summer pause.
That purchase lifted the treasury back to 845,050 coins at an average cost of about $75,412. Total cost basis is about $63.73 billion. At prices near $80,000, the position is worth roughly $67 billion.
Where the treasury stands:
> holdings: 845,050 BTC
> this week: no buys, no sells
> last add: 4,603 BTC for $370 million in late August
> average cost: about $75,412
> cost basis: about $63.73 billion
That matters because Strategy is still the largest public bitcoin treasury. A quiet week means the firm is not adding into the rebound and not selling into it either.
Unchanged is not the same as idle forever. The last cycle already showed they can sell to fund dividends, then buy again. This week they just held.
🚨 BREAKING: Strategy Did Not Touch Its Bitcoin This Week
Michael Saylor’s company still holds 845,050 $BTC. There were no buys and no sells in the past week. The stack is unchanged after last month’s $370 million purchase of 4,603 BTC, which ended a summer pause.
That purchase lifted the treasury back to 845,050 coins at an average cost of about $75,412. Total cost basis is about $63.73 billion. At prices near $80,000, the position is worth roughly $67 billion.
Where the treasury stands:
> holdings: 845,050 BTC
> this week: no buys, no sells
> last add: 4,603 BTC for $370 million in late August
> average cost: about $75,412
> cost basis: about $63.73 billion
That matters because Strategy is still the largest public bitcoin treasury. A quiet week means the firm is not adding into the rebound and not selling into it either.
Unchanged is not the same as idle forever. The last cycle already showed they can sell to fund dividends, then buy again. This week they just held.
Michael Saylor’s company still holds 845,050 $BTC. There were no buys and no sells in the past week. The stack is unchanged after last month’s $370 million purchase of 4,603 BTC, which ended a summer pause.
That purchase lifted the treasury back to 845,050 coins at an average cost of about $75,412. Total cost basis is about $63.73 billion. At prices near $80,000, the position is worth roughly $67 billion.
Where the treasury stands:
> holdings: 845,050 BTC
> this week: no buys, no sells
> last add: 4,603 BTC for $370 million in late August
> average cost: about $75,412
> cost basis: about $63.73 billion
That matters because Strategy is still the largest public bitcoin treasury. A quiet week means the firm is not adding into the rebound and not selling into it either.
Unchanged is not the same as idle forever. The last cycle already showed they can sell to fund dividends, then buy again. This week they just held.


9
10.8k
·
--
HUGE: Bitcoin’s Weekly Supertrend Has Flipped Green Again
The last time this line turned up, a large bull market followed. That does not automatically mean the same percentage run starts today.
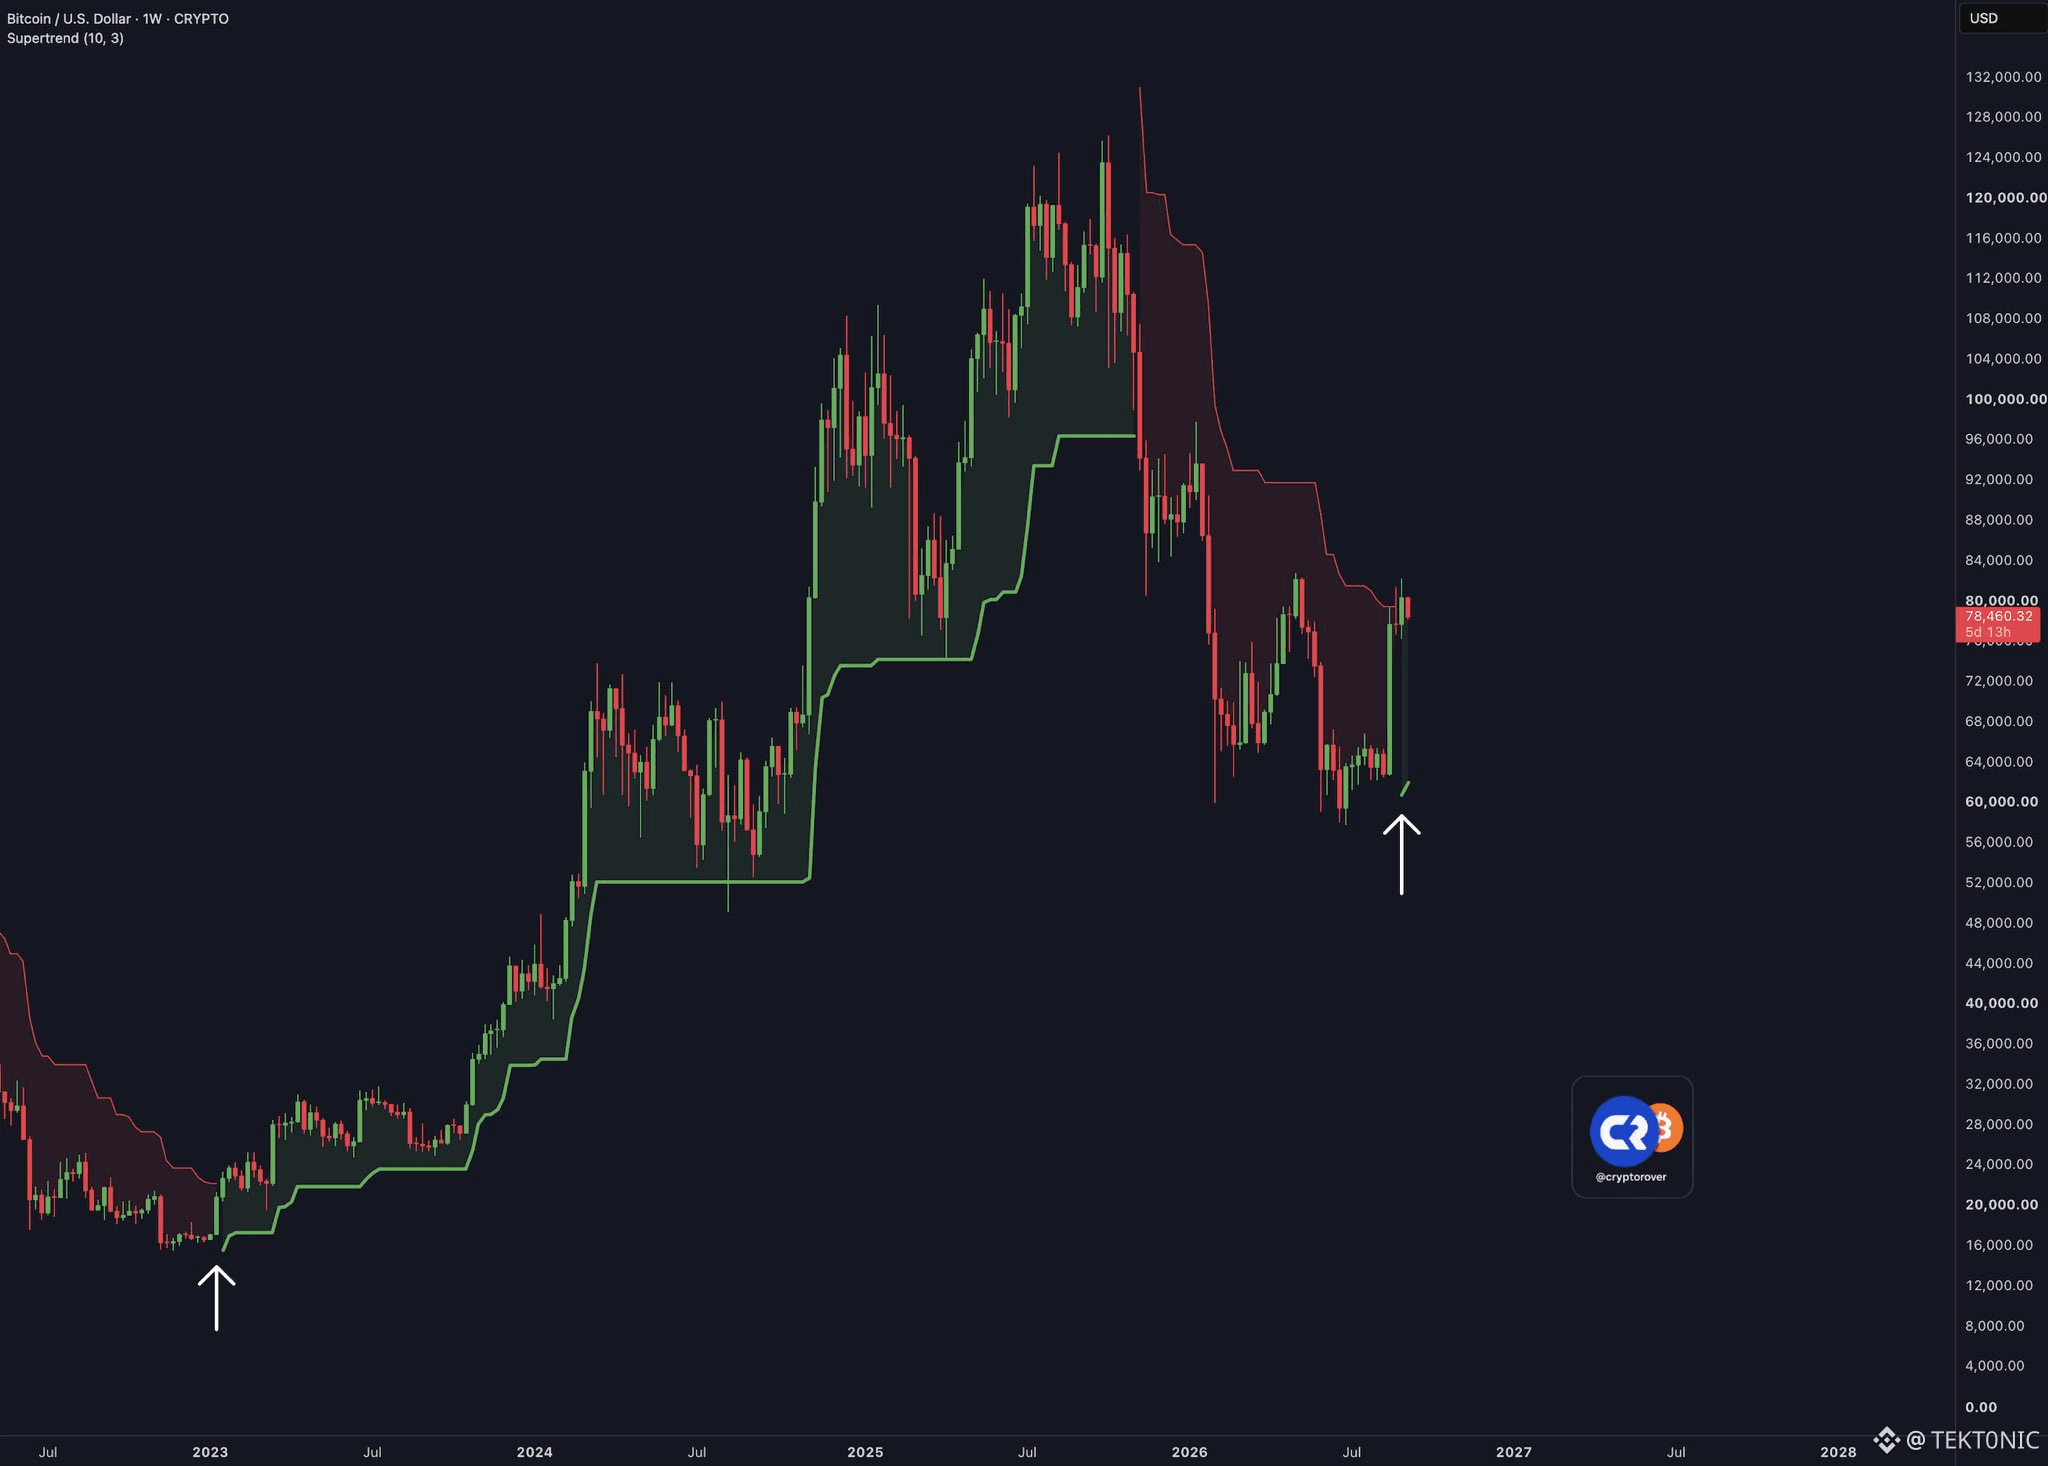
According to the weekly Supertrend chart, the indicator flipped green at the late-2022 / early-2023 low. Bitcoin then advanced from the mid-teens to a cycle high above $120,000. A new green mark is now printing under the 2026 low, with price around $78,460.
Key Details:
> Supertrend green = the weekly model is treating the trend as up.
> Prior flip on this view: early 2023, after the $16,000 area low.
> That advance reached above $120,000 — several hundred percent from the flip zone.
> Current price: about $78,460, still under the declining red Supertrend shelf from the 2025–26 breakdown.
A repeat of “+500%” would require a new cycle high far above $120,000. The honest read is simpler: the same weekly tool that marked the last major low is turning up again. Confirmation is a weekly close that holds the green line. Failure puts the indicator back in the way as resistance.
Weekly Supertrend Green Again Near $78,500 — Last Flip Came Off the 2023 Low
HUGE: Bitcoin’s Weekly Supertrend Has Flipped Green Again
The last time this line turned up, a large bull market followed. That does not automatically mean the same percentage run starts today.
According to the weekly Supertrend chart, the indicator flipped green at the late-2022 / early-2023 low. Bitcoin then advanced from the mid-teens to a cycle high above $120,000. A new green mark is now printing under the 2026 low, with price around $78,460.
Key Details:
> Supertrend green = the weekly model is treating the trend as up.
> Prior flip on this view: early 2023, after the $16,000 area low.
> That advance reached above $120,000 — several hundred percent from the flip zone.
> Current price: about $78,460, still under the declining red Supertrend shelf from the 2025–26 breakdown.
A repeat of “+500%” would require a new cycle high far above $120,000. The honest read is simpler: the same weekly tool that marked the last major low is turning up again. Confirmation is a weekly close that holds the green line. Failure puts the indicator back in the way as resistance.
Weekly Supertrend Green Again Near $78,500 — Last Flip Came Off the 2023 Low
The last time this line turned up, a large bull market followed. That does not automatically mean the same percentage run starts today.
According to the weekly Supertrend chart, the indicator flipped green at the late-2022 / early-2023 low. Bitcoin then advanced from the mid-teens to a cycle high above $120,000. A new green mark is now printing under the 2026 low, with price around $78,460.
Key Details:
> Supertrend green = the weekly model is treating the trend as up.
> Prior flip on this view: early 2023, after the $16,000 area low.
> That advance reached above $120,000 — several hundred percent from the flip zone.
> Current price: about $78,460, still under the declining red Supertrend shelf from the 2025–26 breakdown.
A repeat of “+500%” would require a new cycle high far above $120,000. The honest read is simpler: the same weekly tool that marked the last major low is turning up again. Confirmation is a weekly close that holds the green line. Failure puts the indicator back in the way as resistance.
Weekly Supertrend Green Again Near $78,500 — Last Flip Came Off the 2023 Low
3
2.4k
·
--
BREAKING: Crypto Fear & Greed Is at 72 — Still in Greed, Not Extreme
Sentiment has recovered with the price. It has not gone off the top of the gauge.
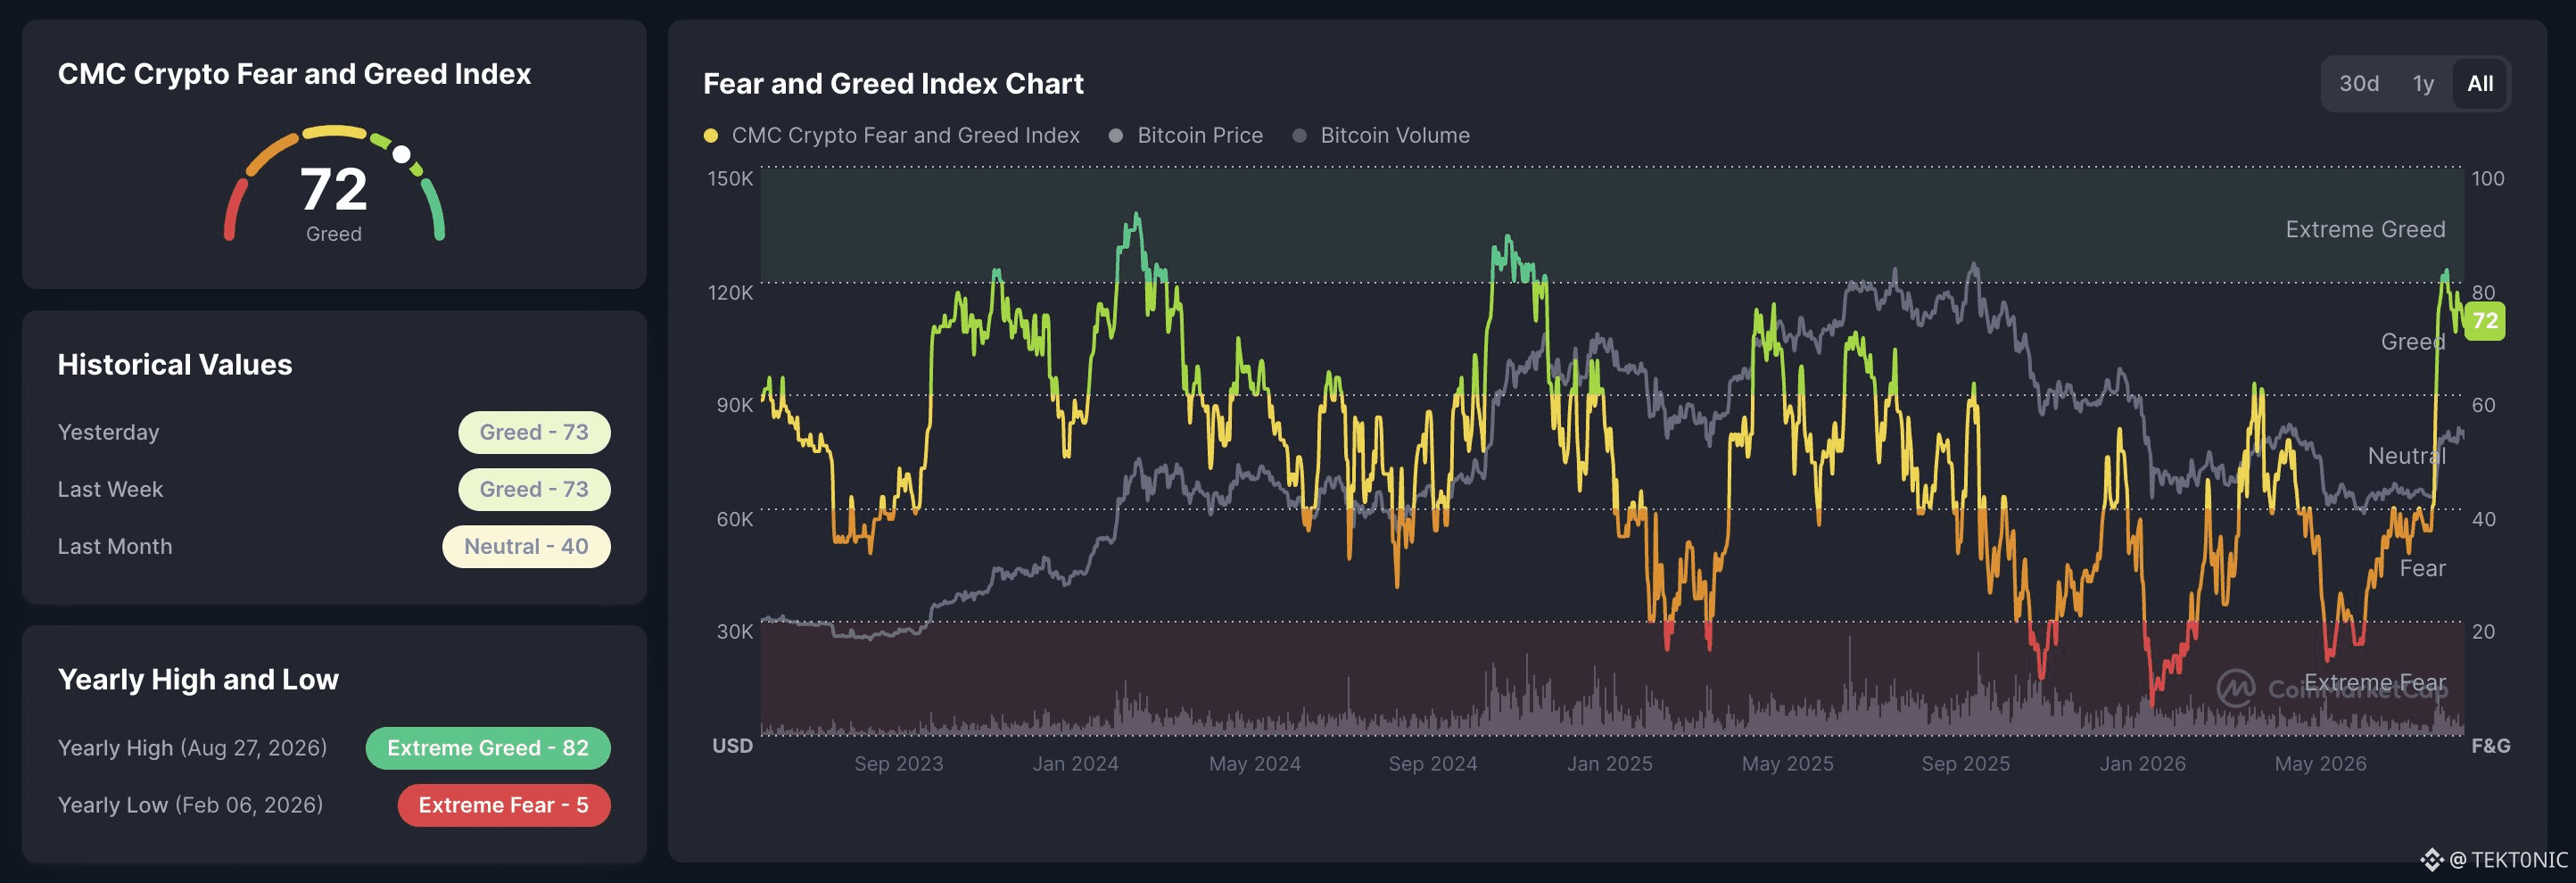
According to CoinMarketCap’s Crypto Fear and Greed Index, the reading is 72 (Greed). Yesterday was 73. Last week was also 73. Last month was Neutral at 40. The yearly high was Extreme Greed at 82 on August 27. The yearly low was Extreme Fear at 5 on February 6.
Key Details:
> Current: 72, Greed.
> One month ago: 40, Neutral.
> Yearly high: 82 (August 27). Yearly low: 5 (February 6).
> The index jumped with Bitcoin’s move off the mid-year lows toward $80,000.
72 means the crowd is optimistic again. It is not the 80-plus zone that marked the most stretched readings this year. In a range around $80,000, a pullback toward Neutral would be the reset some traders want before the next push. A run straight to Extreme Greed from here would mean the move is getting crowded before $83,000 is even cleared.
Fear & Greed at 72: Greed, Below the August 82 High
Do you wait for this gauge to cool off before adding, or do you stay long while it holds the 70s?
BREAKING: Crypto Fear & Greed Is at 72 — Still in Greed, Not Extreme
Sentiment has recovered with the price. It has not gone off the top of the gauge.
According to CoinMarketCap’s Crypto Fear and Greed Index, the reading is 72 (Greed). Yesterday was 73. Last week was also 73. Last month was Neutral at 40. The yearly high was Extreme Greed at 82 on August 27. The yearly low was Extreme Fear at 5 on February 6.
Key Details:
> Current: 72, Greed.
> One month ago: 40, Neutral.
> Yearly high: 82 (August 27). Yearly low: 5 (February 6).
> The index jumped with Bitcoin’s move off the mid-year lows toward $80,000.
72 means the crowd is optimistic again. It is not the 80-plus zone that marked the most stretched readings this year. In a range around $80,000, a pullback toward Neutral would be the reset some traders want before the next push. A run straight to Extreme Greed from here would mean the move is getting crowded before $83,000 is even cleared.
Fear & Greed at 72: Greed, Below the August 82 High
Do you wait for this gauge to cool off before adding, or do you stay long while it holds the 70s?
Sentiment has recovered with the price. It has not gone off the top of the gauge.
According to CoinMarketCap’s Crypto Fear and Greed Index, the reading is 72 (Greed). Yesterday was 73. Last week was also 73. Last month was Neutral at 40. The yearly high was Extreme Greed at 82 on August 27. The yearly low was Extreme Fear at 5 on February 6.
Key Details:
> Current: 72, Greed.
> One month ago: 40, Neutral.
> Yearly high: 82 (August 27). Yearly low: 5 (February 6).
> The index jumped with Bitcoin’s move off the mid-year lows toward $80,000.
72 means the crowd is optimistic again. It is not the 80-plus zone that marked the most stretched readings this year. In a range around $80,000, a pullback toward Neutral would be the reset some traders want before the next push. A run straight to Extreme Greed from here would mean the move is getting crowded before $83,000 is even cleared.
Fear & Greed at 72: Greed, Below the August 82 High
Do you wait for this gauge to cool off before adding, or do you stay long while it holds the 70s?
2
1.3k
·
--
HUGE: Short-Term Bitcoin Whales Are Sitting on $9.07B in Paper Profit
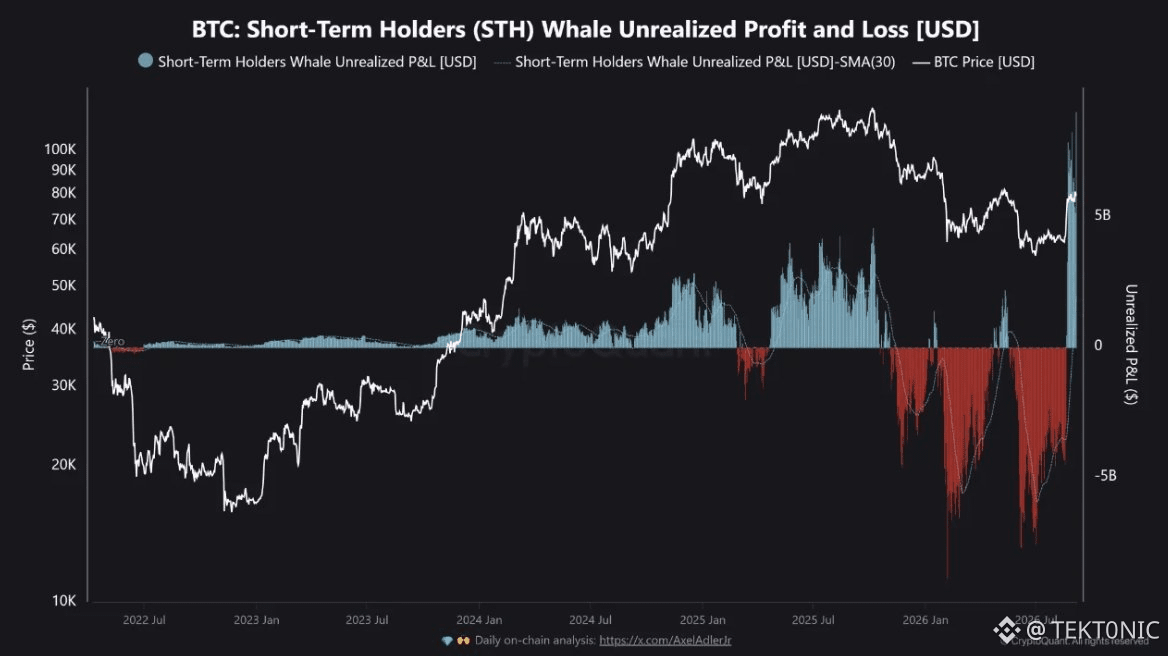
Unrealized profit for short-term holder whales just hit $9.07 billion, the most since 2016, according to CryptoQuant. These are large wallets that bought in the last 155 days. After months in the red through 2026, the August rebound flipped that book into a record gain.
This is not cash in the bank. It is mark-to-market profit on coins that have not been sold yet. Short-term whales have a history of being first to sell when price stalls.
What the chart is showing:
> STH whale unrealized P&L: $9.07 billion
> highest since 2016
> long stretch of losses through mid-2026
> flip came with the bounce toward $80,000
> 30-day average is turning up with the spike
That matters because paper profit can turn into supply. If BTC wobbles, these wallets are the group most likely to lock in gains. That is the selling pressure the analyst is flagging.
A record profit print is not a buy signal. It is a warning that the newest large buyers are finally green — and green short-term whales often sell.
HUGE: Short-Term Bitcoin Whales Are Sitting on $9.07B in Paper Profit
Unrealized profit for short-term holder whales just hit $9.07 billion, the most since 2016, according to CryptoQuant. These are large wallets that bought in the last 155 days. After months in the red through 2026, the August rebound flipped that book into a record gain.
This is not cash in the bank. It is mark-to-market profit on coins that have not been sold yet. Short-term whales have a history of being first to sell when price stalls.
What the chart is showing:
> STH whale unrealized P&L: $9.07 billion
> highest since 2016
> long stretch of losses through mid-2026
> flip came with the bounce toward $80,000
> 30-day average is turning up with the spike
That matters because paper profit can turn into supply. If BTC wobbles, these wallets are the group most likely to lock in gains. That is the selling pressure the analyst is flagging.
A record profit print is not a buy signal. It is a warning that the newest large buyers are finally green — and green short-term whales often sell.
Unrealized profit for short-term holder whales just hit $9.07 billion, the most since 2016, according to CryptoQuant. These are large wallets that bought in the last 155 days. After months in the red through 2026, the August rebound flipped that book into a record gain.
This is not cash in the bank. It is mark-to-market profit on coins that have not been sold yet. Short-term whales have a history of being first to sell when price stalls.
What the chart is showing:
> STH whale unrealized P&L: $9.07 billion
> highest since 2016
> long stretch of losses through mid-2026
> flip came with the bounce toward $80,000
> 30-day average is turning up with the spike
That matters because paper profit can turn into supply. If BTC wobbles, these wallets are the group most likely to lock in gains. That is the selling pressure the analyst is flagging.
A record profit print is not a buy signal. It is a warning that the newest large buyers are finally green — and green short-term whales often sell.
3
577
·
--
Проверено
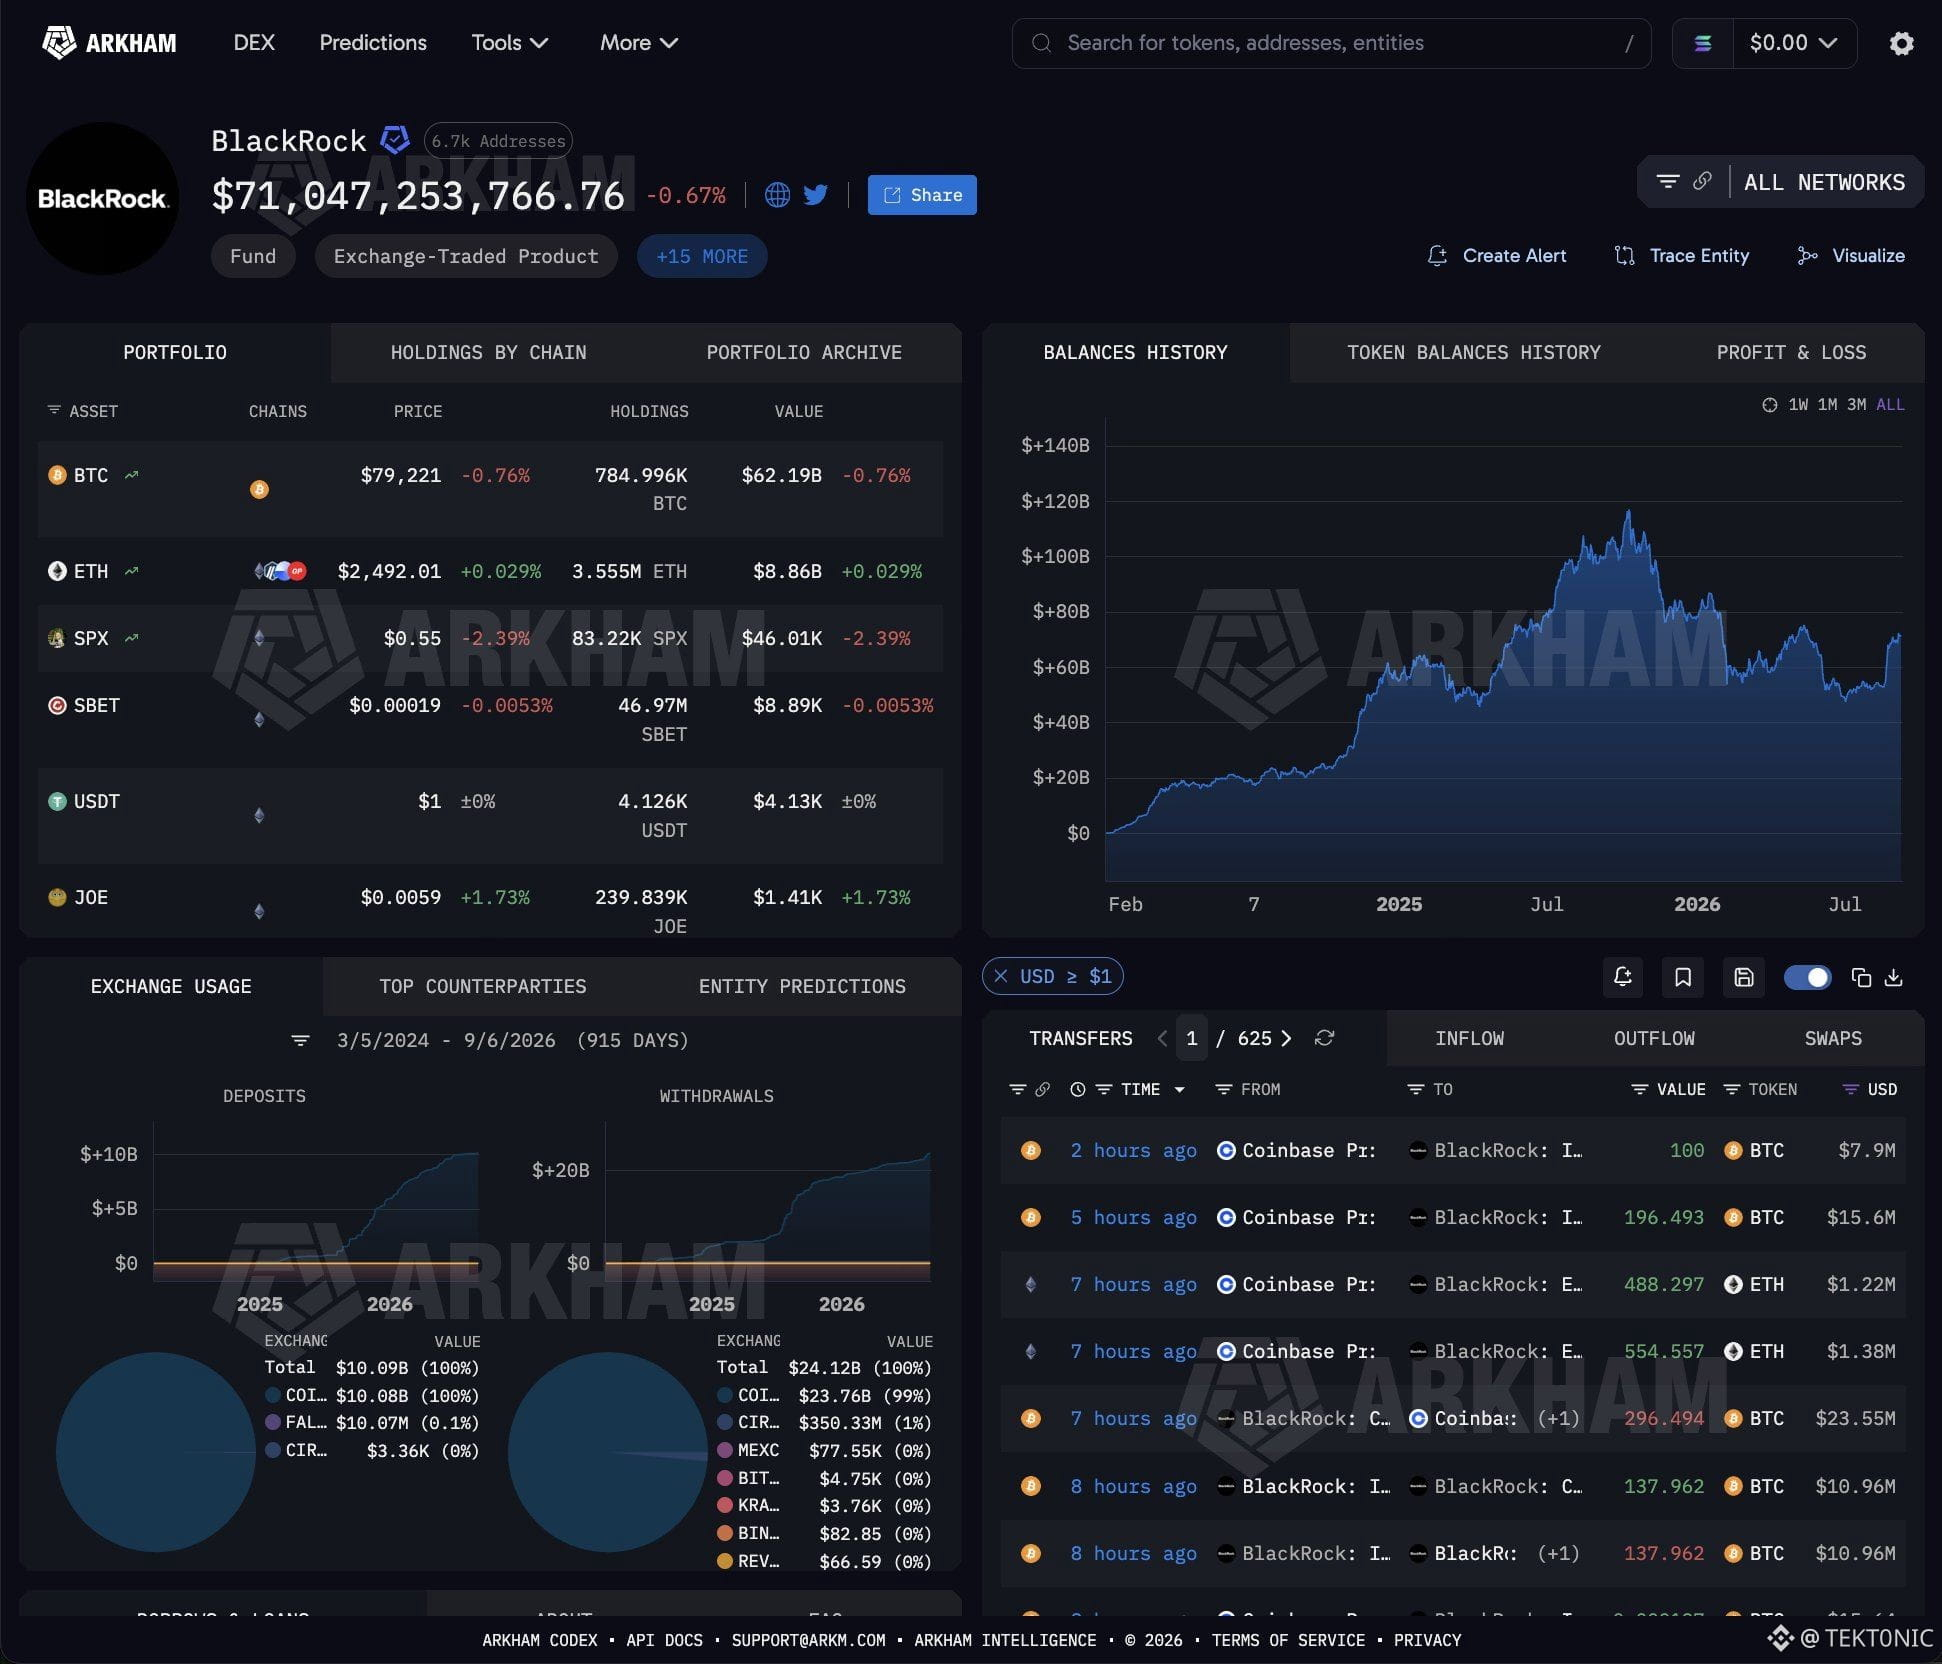
🚨 BREAKING: BlackRock Clients Bought About $687 Million of Bitcoin in Three Days
IBIT is doing the heavy lifting again.
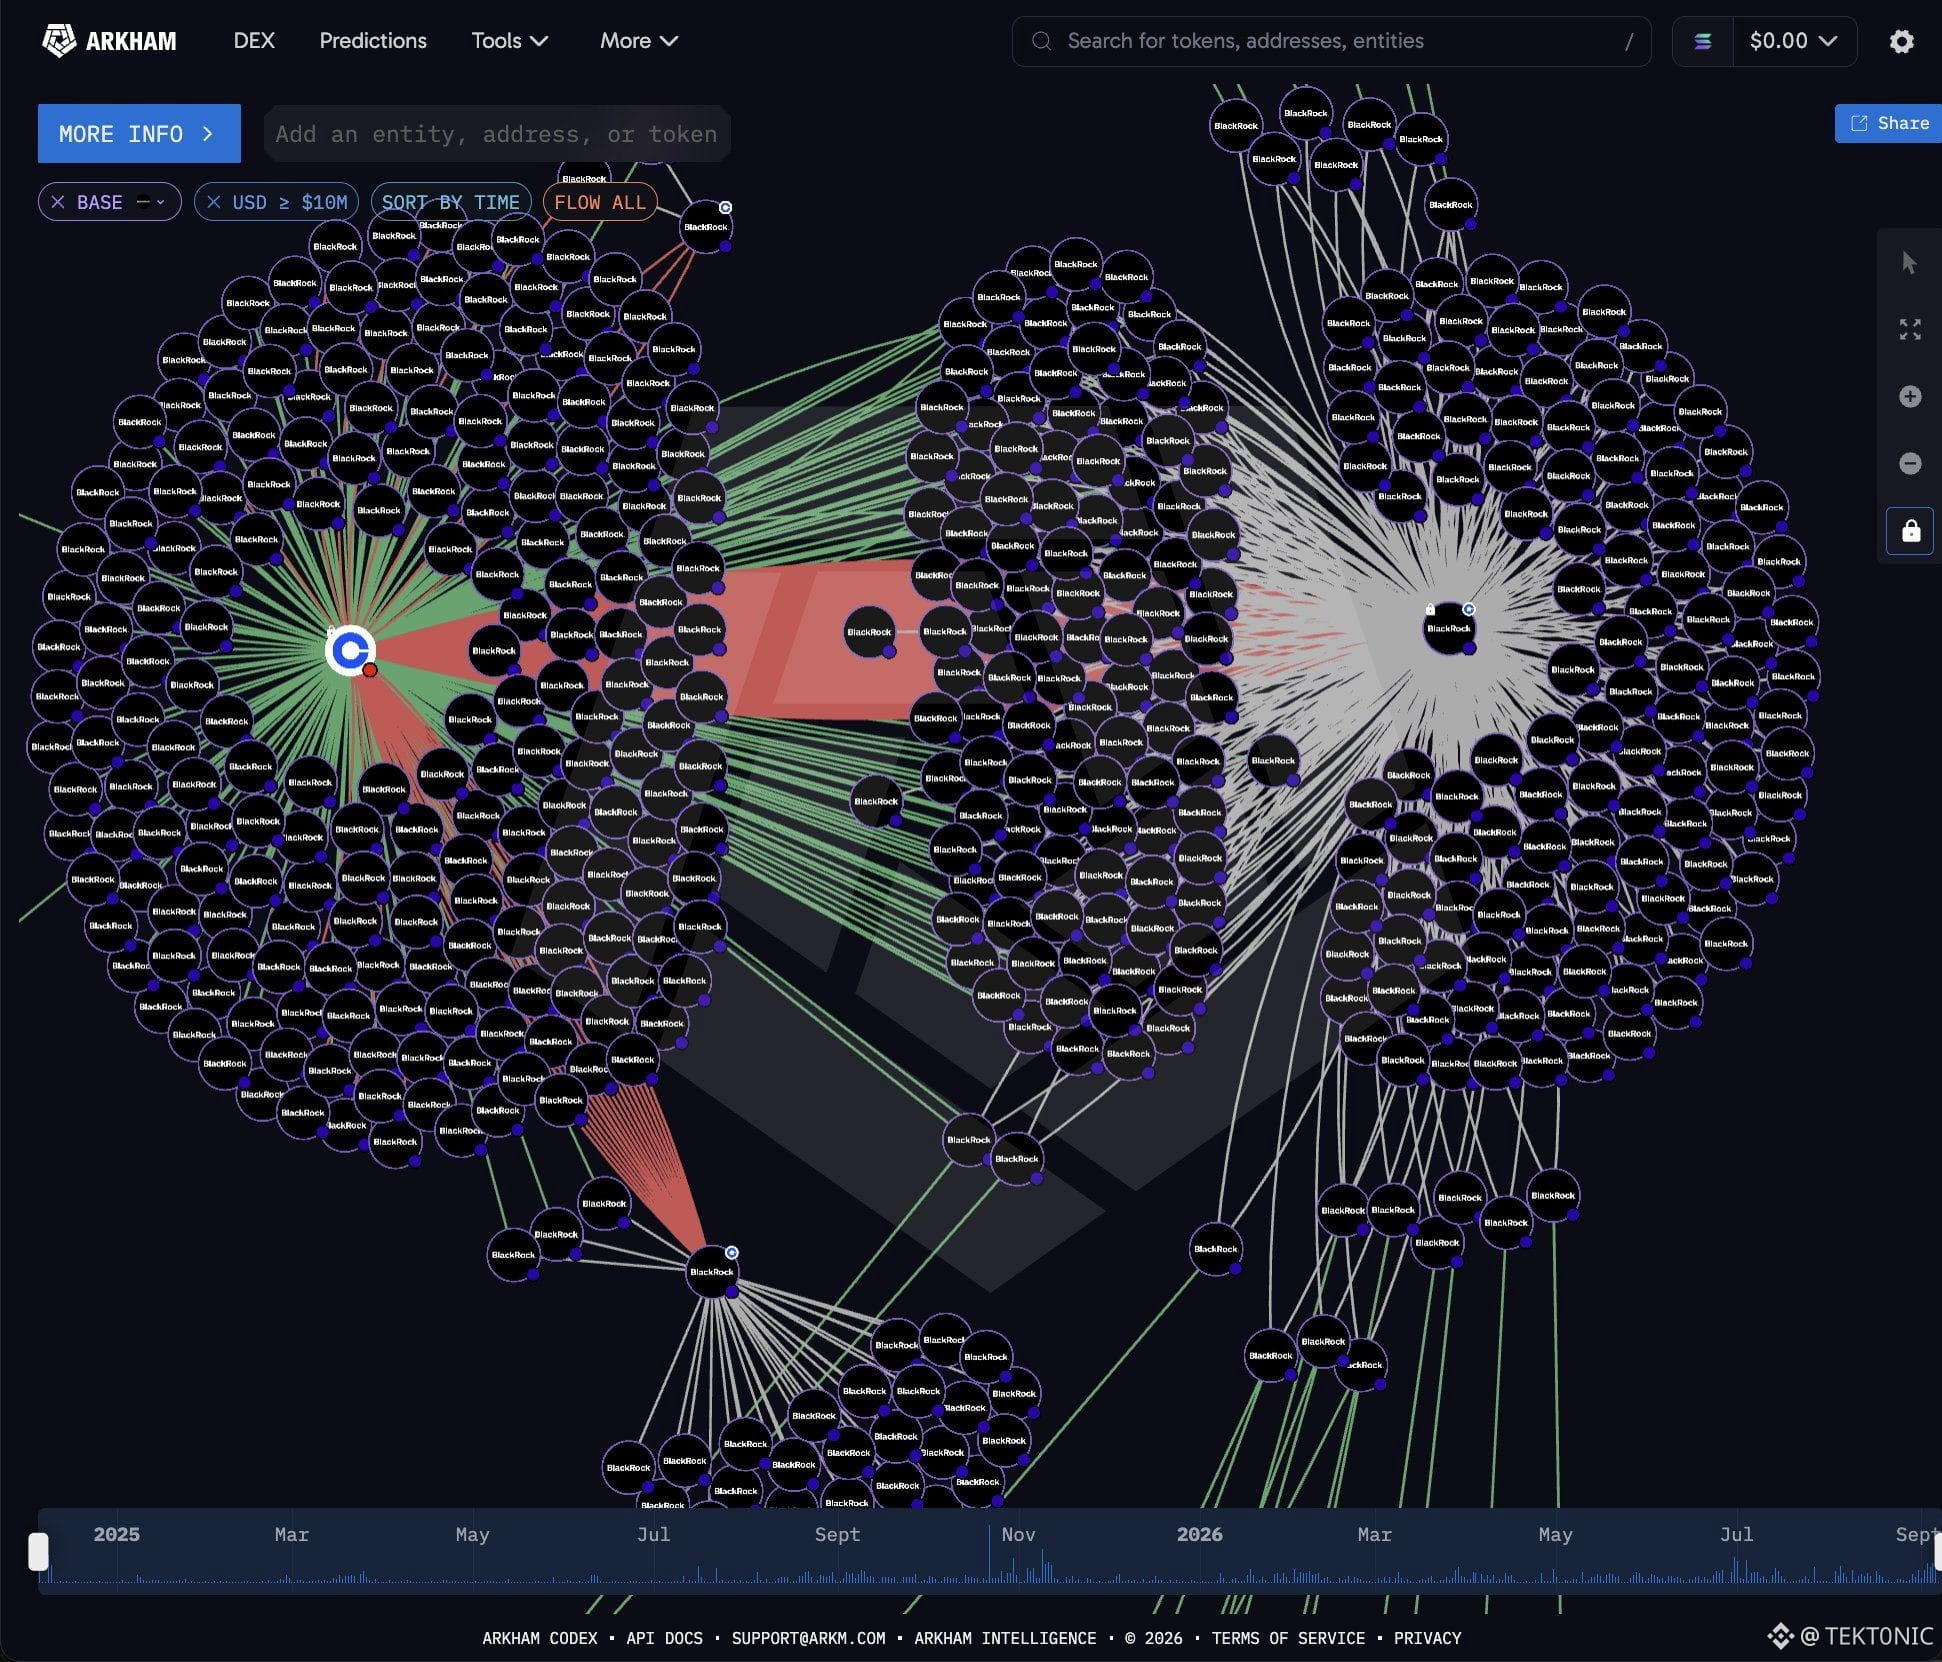
According to the latest flow figures, BlackRock’s iShares Bitcoin Trust took in $117.4 million on Friday. That was the third straight day of buying. Across those three sessions IBIT clients added $686.8 million of Bitcoin. BlackRock’s Ether funds bought $74.2 million on Friday, with ETHB now on a four-day buy streak.
Key Details:
> IBIT Friday: +$117.4 million.
> IBIT three-day total: +$686.8 million.
> ETH funds Friday: +$74.2 million. ETHB: four-day buy streak.
These are client creations into the ETFs, not a discretionary trade off BlackRock’s own balance sheet.
Nearly $687 million in three days is enough to matter next to the $80,000 level. It does not clear $83,000 by itself. The question for this week is whether that bid survives Friday CPI, when hike odds can move in a single print.
BlackRock IBIT: +$117.4M Friday, +$686.8M Over Three Days
Do you expect another $100 million-plus day this week, or does CPI freeze the creations?
🚨 BREAKING: BlackRock Clients Bought About $687 Million of Bitcoin in Three Days
IBIT is doing the heavy lifting again.
According to the latest flow figures, BlackRock’s iShares Bitcoin Trust took in $117.4 million on Friday. That was the third straight day of buying. Across those three sessions IBIT clients added $686.8 million of Bitcoin. BlackRock’s Ether funds bought $74.2 million on Friday, with ETHB now on a four-day buy streak.
Key Details:
> IBIT Friday: +$117.4 million.
> IBIT three-day total: +$686.8 million.
> ETH funds Friday: +$74.2 million. ETHB: four-day buy streak.
These are client creations into the ETFs, not a discretionary trade off BlackRock’s own balance sheet.
Nearly $687 million in three days is enough to matter next to the $80,000 level. It does not clear $83,000 by itself. The question for this week is whether that bid survives Friday CPI, when hike odds can move in a single print.
BlackRock IBIT: +$117.4M Friday, +$686.8M Over Three Days
Do you expect another $100 million-plus day this week, or does CPI freeze the creations?
IBIT is doing the heavy lifting again.
According to the latest flow figures, BlackRock’s iShares Bitcoin Trust took in $117.4 million on Friday. That was the third straight day of buying. Across those three sessions IBIT clients added $686.8 million of Bitcoin. BlackRock’s Ether funds bought $74.2 million on Friday, with ETHB now on a four-day buy streak.
Key Details:
> IBIT Friday: +$117.4 million.
> IBIT three-day total: +$686.8 million.
> ETH funds Friday: +$74.2 million. ETHB: four-day buy streak.
These are client creations into the ETFs, not a discretionary trade off BlackRock’s own balance sheet.
Nearly $687 million in three days is enough to matter next to the $80,000 level. It does not clear $83,000 by itself. The question for this week is whether that bid survives Friday CPI, when hike odds can move in a single print.
BlackRock IBIT: +$117.4M Friday, +$686.8M Over Three Days
Do you expect another $100 million-plus day this week, or does CPI freeze the creations?
3
1.6k
·
--
Проверено
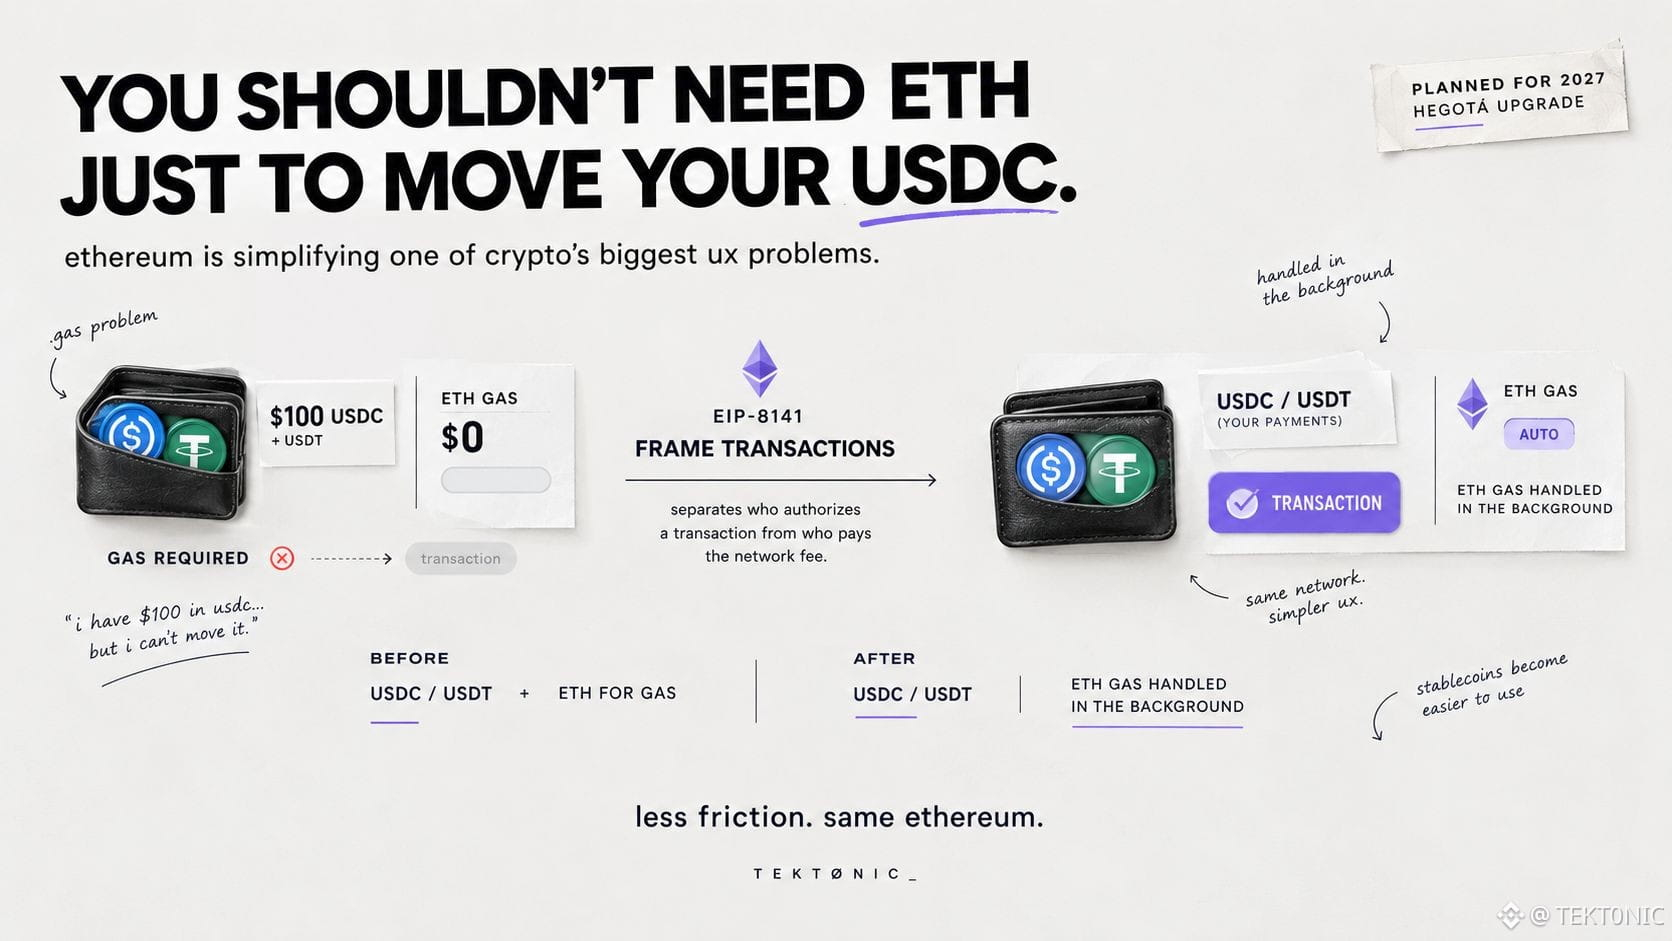
ethereum is making one of crypto’s biggest ux problems much simpler.
starting with the planned Hegotá upgrade in 2027, users could make ethereum transactions without having to hold ETH just to pay gas.
the change comes through Frame Transactions (EIP-8141), which separates the account authorizing a transaction from the account paying the network fee.
so if you’re holding USDC or USDT, a wallet or payment app could take the stablecoin from you and handle the ETH gas payment in the background.
no more:
“i have $100 in usdc but can’t move it because i don’t have $2 of eth.”
this could make ethereum much easier for stablecoin users, especially as stablecoins become a bigger part of payments and everyday transactions.
ETH would still be used to pay the network.
the difference is that users may no longer need to hold it themselves just to transact.
that’s a pretty big improvement for the ethereum user experience.
ethereum is making one of crypto’s biggest ux problems much simpler.
starting with the planned Hegotá upgrade in 2027, users could make ethereum transactions without having to hold ETH just to pay gas.
the change comes through Frame Transactions (EIP-8141), which separates the account authorizing a transaction from the account paying the network fee.
so if you’re holding USDC or USDT, a wallet or payment app could take the stablecoin from you and handle the ETH gas payment in the background.
no more:
“i have $100 in usdc but can’t move it because i don’t have $2 of eth.”
this could make ethereum much easier for stablecoin users, especially as stablecoins become a bigger part of payments and everyday transactions.
ETH would still be used to pay the network.
the difference is that users may no longer need to hold it themselves just to transact.
that’s a pretty big improvement for the ethereum user experience.
starting with the planned Hegotá upgrade in 2027, users could make ethereum transactions without having to hold ETH just to pay gas.
the change comes through Frame Transactions (EIP-8141), which separates the account authorizing a transaction from the account paying the network fee.
so if you’re holding USDC or USDT, a wallet or payment app could take the stablecoin from you and handle the ETH gas payment in the background.
no more:
“i have $100 in usdc but can’t move it because i don’t have $2 of eth.”
this could make ethereum much easier for stablecoin users, especially as stablecoins become a bigger part of payments and everyday transactions.
ETH would still be used to pay the network.
the difference is that users may no longer need to hold it themselves just to transact.
that’s a pretty big improvement for the ethereum user experience.
1
4
1.1k
·
--
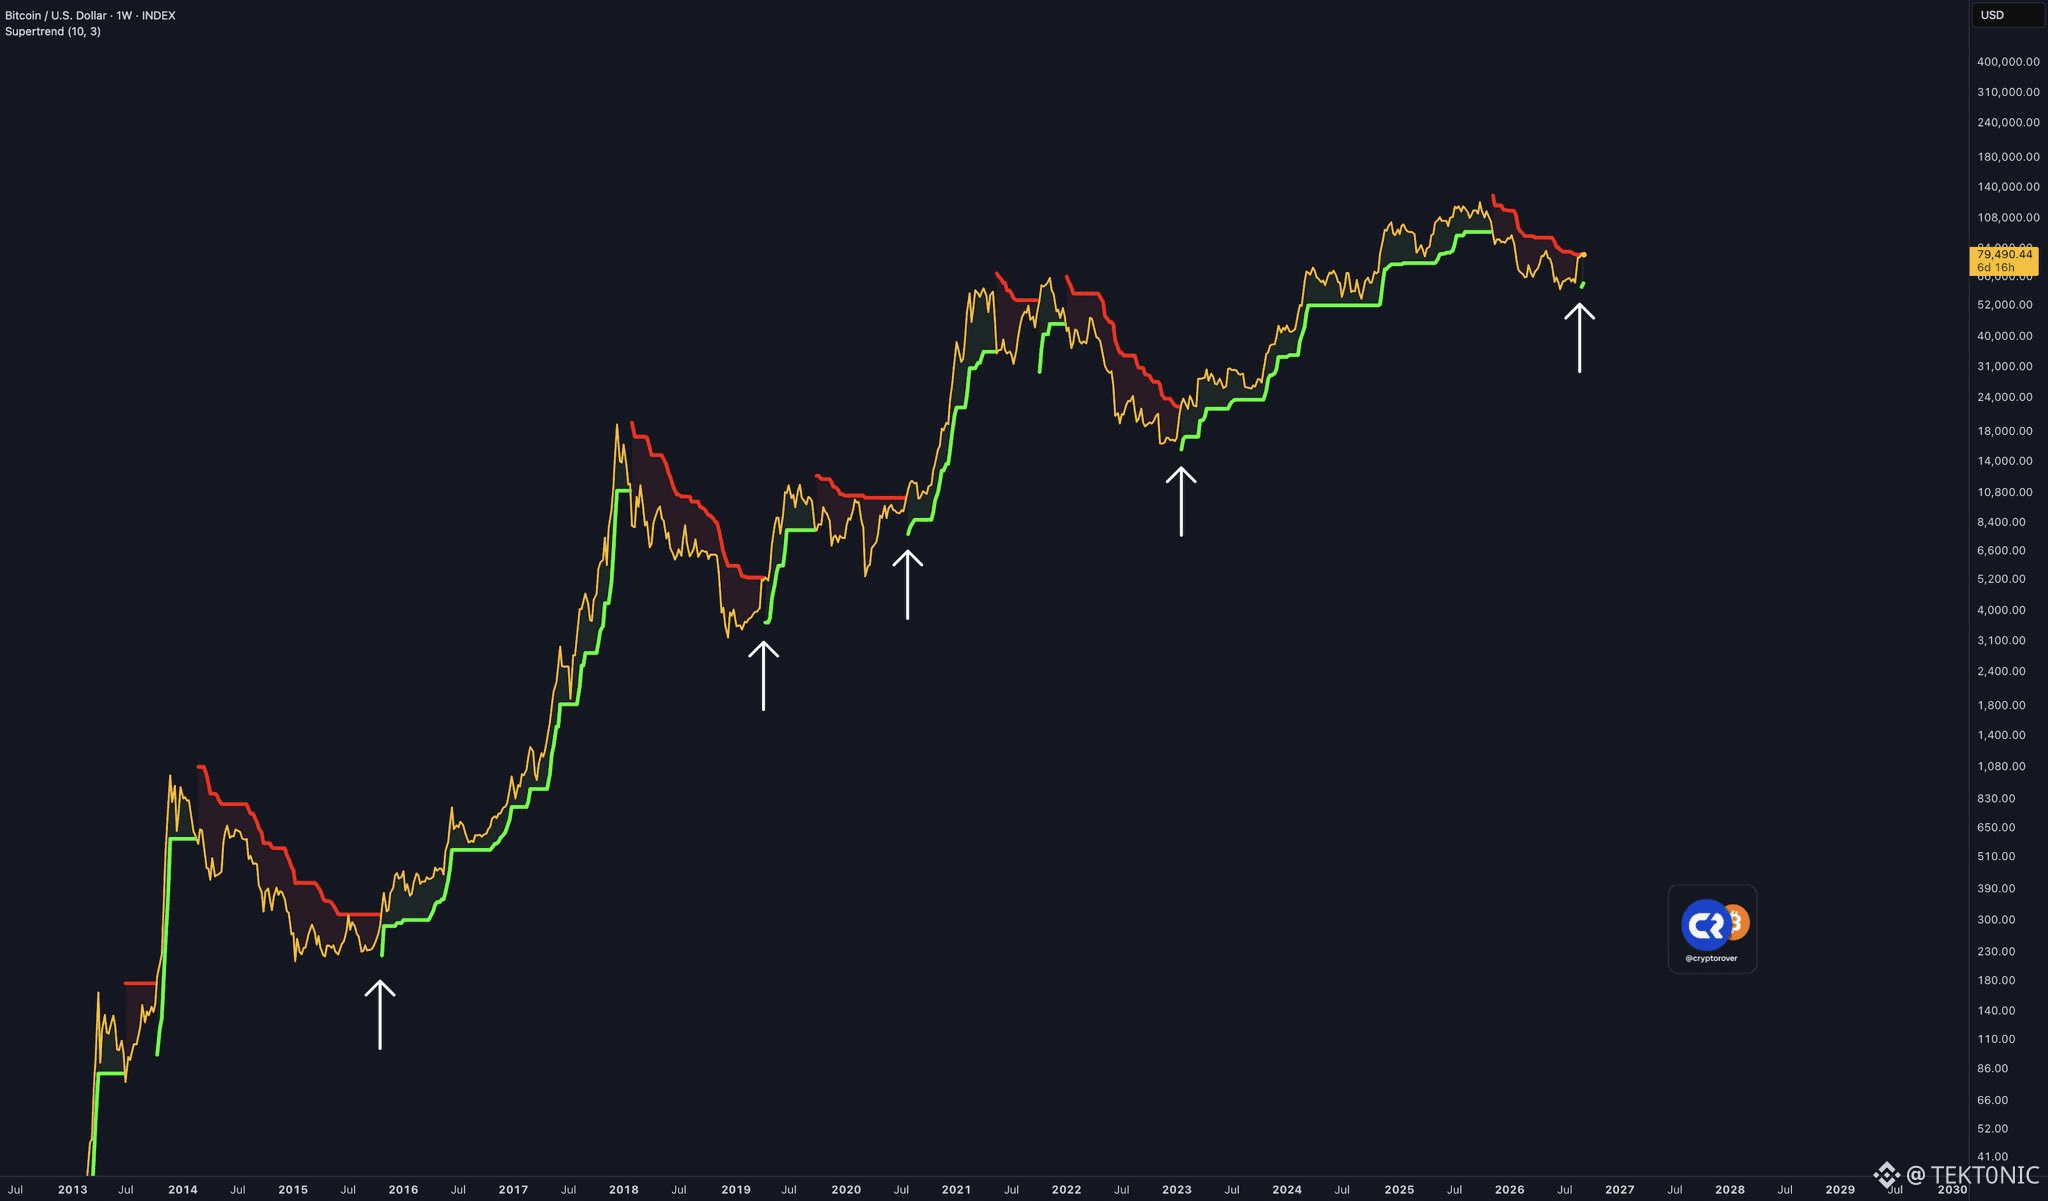
Bitcoin’s Weekly Supertrend Is Flipping Back to Green
The same indicator that marked prior cycle turns is being tested again.
According to the weekly Supertrend chart, Bitcoin is near $79,490. The line has shifted from red to a new green mark at the latest low — the same style of flip that appeared in 2015, 2019, 2020, and late 2022. Those earlier green turns lined up with the start of multi-month advances.
Key Details:
Supertrend on the weekly is a trend overlay. Green means the model is treating the market as up. Red means down.
Prior green flips on this chart sat near the 2015, 2019, 2020, and 2022 lows.
The latest arrow is under the 2026 low, with price back toward $80,000.
A flip is only useful if the week holds. Lose the Supertrend line again and it can turn back to resistance.
This is a timing tool, not a promise. It caught the last four major recoveries on this view. It does not guarantee the next one. The confirmation is a weekly close that keeps the line green and price above it — not the first green dot alone.
Weekly Supertrend Turns Green Near $79,500 — Same Signal That Marked Prior Cycle Lows
Do you treat this flip as the official trend change, or wait for a second weekly close still above the line?
Bitcoin’s Weekly Supertrend Is Flipping Back to Green
The same indicator that marked prior cycle turns is being tested again.
According to the weekly Supertrend chart, Bitcoin is near $79,490. The line has shifted from red to a new green mark at the latest low — the same style of flip that appeared in 2015, 2019, 2020, and late 2022. Those earlier green turns lined up with the start of multi-month advances.
Key Details:
Supertrend on the weekly is a trend overlay. Green means the model is treating the market as up. Red means down.
Prior green flips on this chart sat near the 2015, 2019, 2020, and 2022 lows.
The latest arrow is under the 2026 low, with price back toward $80,000.
A flip is only useful if the week holds. Lose the Supertrend line again and it can turn back to resistance.
This is a timing tool, not a promise. It caught the last four major recoveries on this view. It does not guarantee the next one. The confirmation is a weekly close that keeps the line green and price above it — not the first green dot alone.
Weekly Supertrend Turns Green Near $79,500 — Same Signal That Marked Prior Cycle Lows
Do you treat this flip as the official trend change, or wait for a second weekly close still above the line?
The same indicator that marked prior cycle turns is being tested again.
According to the weekly Supertrend chart, Bitcoin is near $79,490. The line has shifted from red to a new green mark at the latest low — the same style of flip that appeared in 2015, 2019, 2020, and late 2022. Those earlier green turns lined up with the start of multi-month advances.
Key Details:
Supertrend on the weekly is a trend overlay. Green means the model is treating the market as up. Red means down.
Prior green flips on this chart sat near the 2015, 2019, 2020, and 2022 lows.
The latest arrow is under the 2026 low, with price back toward $80,000.
A flip is only useful if the week holds. Lose the Supertrend line again and it can turn back to resistance.
This is a timing tool, not a promise. It caught the last four major recoveries on this view. It does not guarantee the next one. The confirmation is a weekly close that keeps the line green and price above it — not the first green dot alone.
Weekly Supertrend Turns Green Near $79,500 — Same Signal That Marked Prior Cycle Lows
Do you treat this flip as the official trend change, or wait for a second weekly close still above the line?
3
7
13.3k
Войдите, чтобы посмотреть больше материала
Присоединяйтесь к пользователям криптовалют по всему миру на Binance Square
⚡️ Получайте новейшую и полезную информацию о криптоактивах.
💬 Нам доверяет крупнейшая в мире криптобиржа.
👍 Получите достоверные аналитические данные от верифицированных создателей контента.
Эл. почта/номер телефона
В тренде
BinanceKZ
Просмотров: 30,120
73 обсуждают
Как я потерял 180 000 тенге на «менеджере Binance» из WhatsApp — и почему всё равно остался в крипте
phpdead
·Лайков: 6
·Просмотров: 2.4k
EtherGains70.9%InQ3
Просмотров: 14,819
278 обсуждают
TreasuryLetsStatesFileStablecoinCertificationsEarly
Просмотров: 0
1 обсуждают