$ARB Holding Steady After the Big Run, What’s Next?
Alright guys, check out this $ARB 4h chart real quick 👀
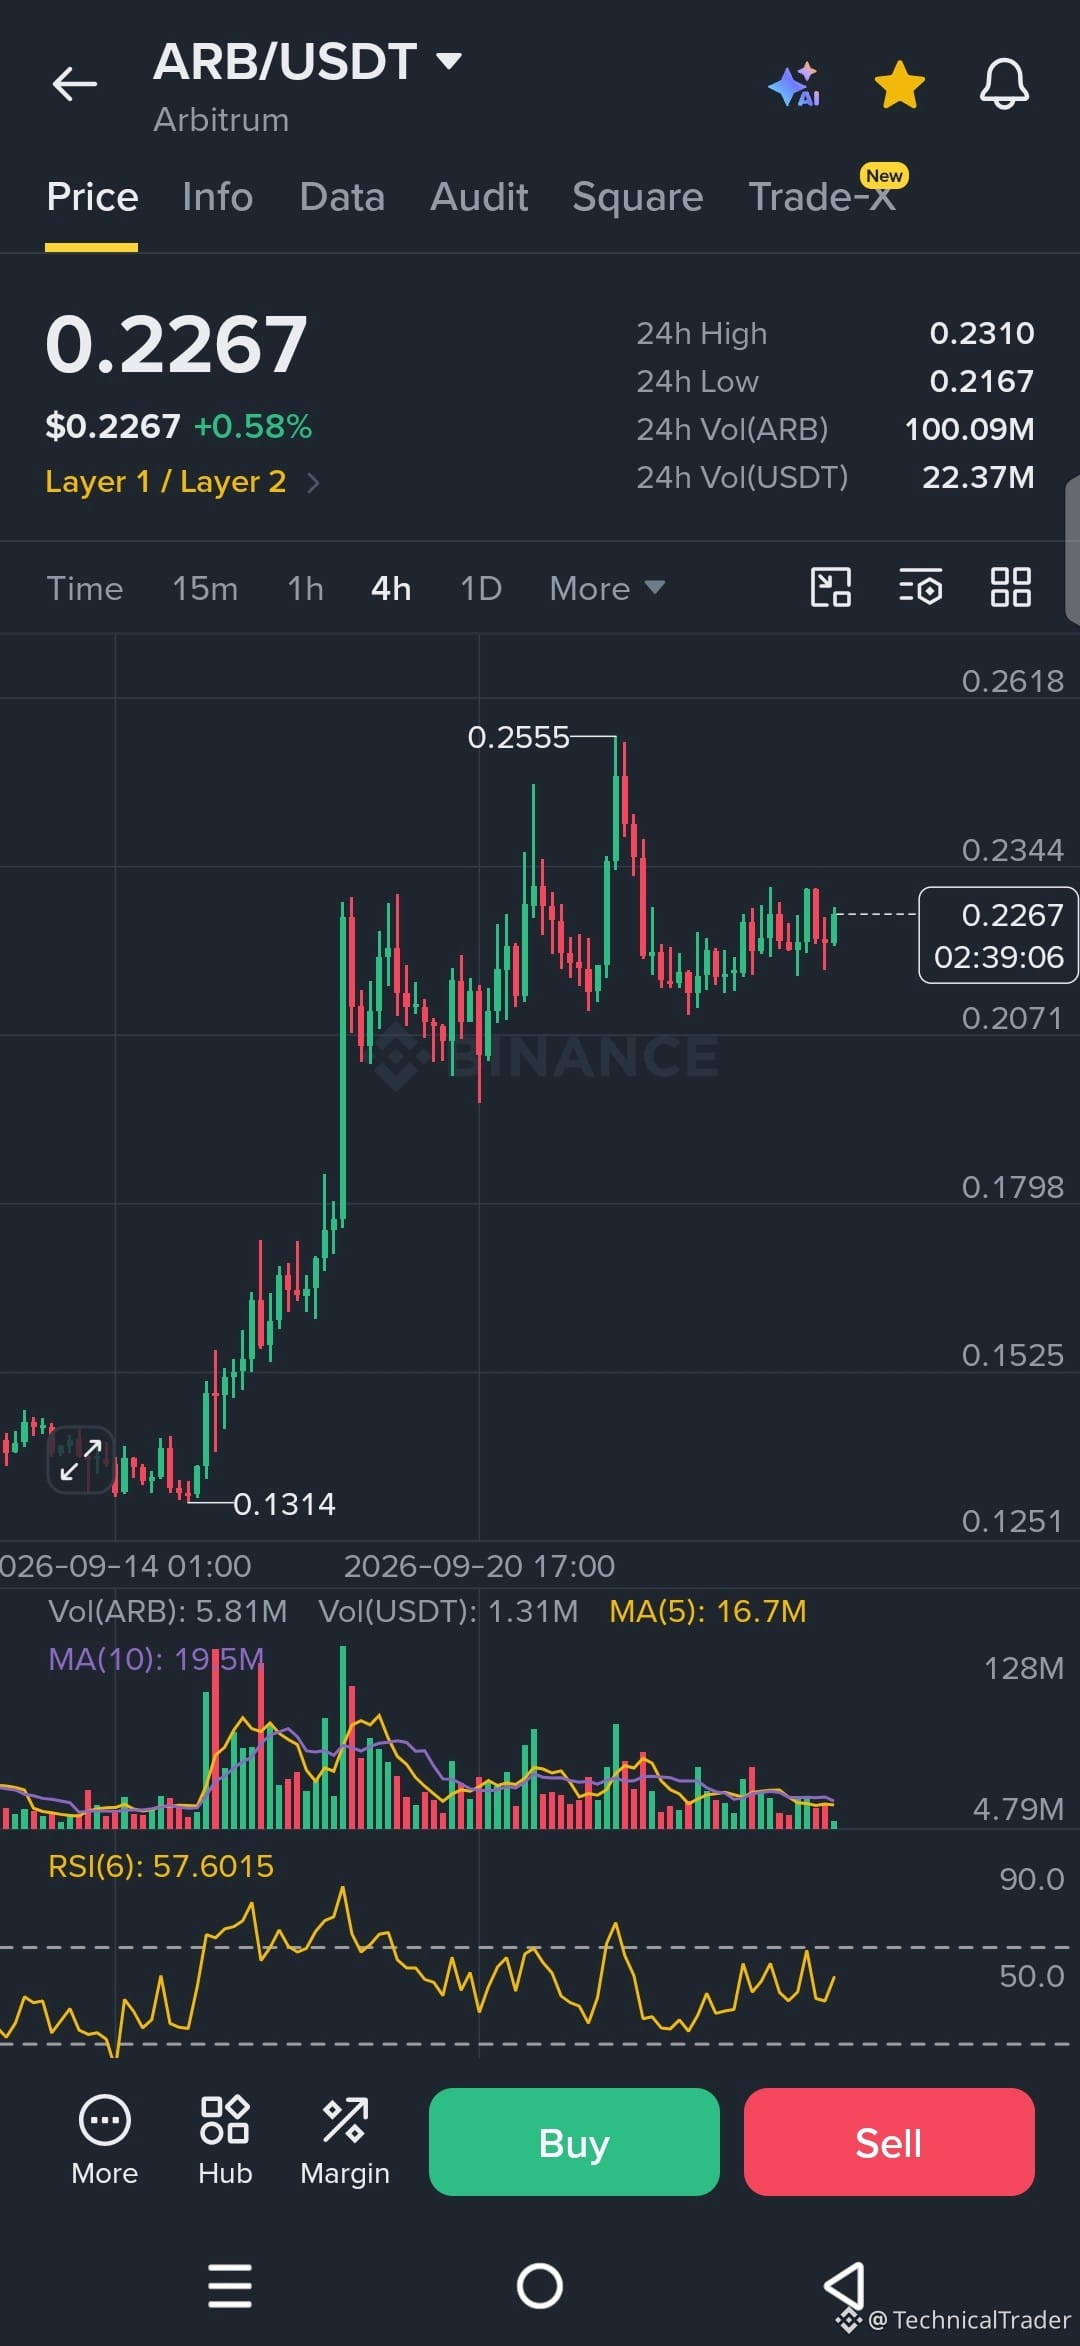
Price is sitting right at 0.2267 after that strong push higher earlier. We had a clean run from the lows near 0.1314 all the way up to that 0.2555 high, printing some solid higher highs and higher lows along the way.
Since then it’s pulled back and been chopping around in this mid-range, not really breaking down hard but also not blasting higher yet.
Look at this area around 0.22–0.23… price has been reacting here a few times. We saw some decent volume coming in on those earlier green candles during the pump, and now volume has cooled off a bit while RSI sits around 57, not screaming overbought or oversold, just neutral.
If bulls can push through and hold above that recent 0.2310 area, we could start looking for another leg up toward the previous high around 0.2555. That would keep the overall structure looking healthy.
On the flip side, if we start losing the 0.2167–0.22 zone with some conviction, sellers could drag it lower and test those earlier support pockets from the climb.
Right now I’m watching how price behaves around this 0.2267 level and whether we get a clean break or another rejection. A strong close above 0.2310 would make the bullish case stronger, while a drop and hold below 0.2167 would shift the focus lower.
Guys follow for more chart analysis 😎 I’ll keep showing you exactly what the chart is telling us. 👀🔥
Alright guys, check out this $ARB 4h chart real quick 👀
Price is sitting right at 0.2267 after that strong push higher earlier. We had a clean run from the lows near 0.1314 all the way up to that 0.2555 high, printing some solid higher highs and higher lows along the way.
Since then it’s pulled back and been chopping around in this mid-range, not really breaking down hard but also not blasting higher yet.
Look at this area around 0.22–0.23… price has been reacting here a few times. We saw some decent volume coming in on those earlier green candles during the pump, and now volume has cooled off a bit while RSI sits around 57, not screaming overbought or oversold, just neutral.
If bulls can push through and hold above that recent 0.2310 area, we could start looking for another leg up toward the previous high around 0.2555. That would keep the overall structure looking healthy.
On the flip side, if we start losing the 0.2167–0.22 zone with some conviction, sellers could drag it lower and test those earlier support pockets from the climb.
Right now I’m watching how price behaves around this 0.2267 level and whether we get a clean break or another rejection. A strong close above 0.2310 would make the bullish case stronger, while a drop and hold below 0.2167 would shift the focus lower.
Guys follow for more chart analysis 😎 I’ll keep showing you exactly what the chart is telling us. 👀🔥